
Page 9 - IJB-6-4
P. 9
He, et al.
for filtering facepieces standard tests, which properties of the nanofibers, but achieve proper
works with~600 nm NaCl aerosol particles. The adhesion with the printed layer, we adjusted the
filtration efficiency was calculated, respectively, bed temperature to 60°C.
from particle number difference (n%) and mass The optical properties of all the filters printed
difference (wt%) before and after 1 min filtration. with variable nozzle temperatures are shown in
Filtration efficiency (n%) was used to describe the Figure 3. On the black background, the whitish
filtration performance with different particle sizes. nanofiber mat incorporated with the printed part
Filtration efficiency (wt%) was mainly used to was visible, as shown in Figure 3A. Compared
evaluate the particle removal ability of a mask for with the reference samples without nanofibers, our
particles between 0.3 and 5 μm because they are university logo underneath the filter was a little bit
the most harmful particulate matter pollutants to blurry, but visible, as shown in Figure 3B. The
humans and can reach the lower respiratory tract. UV–visible spectra were measured to examine
The nanoporous filters were printed into a 35 mm the transmittance of the printed nanocomposite
diameter circular shape and fixed into the filter quantitatively. The results are shown in Figure 3E.
holder connected to the particle counter. All the It is worth noting that the reference sample (without
tests were conducted with an airflow of 30 l/min, nanofibers) presented better optical transmittance,
which is approximately the average breathing flow and the reference sample printed at 210°C had
of humans in a resting position. Five specimens the lowest transmittance amongst the references.
were tested from each sample type. As good In comparison with the reference samples, the
quality commercial masks contain several filtering fabricated filters had lower transmittance. The
layers, we also stacked the specimens in 2, 3, 4, reason for the lower transmittance of the printed
and 5 layers after the single layer measurements. nanocomposite may be due to the nanofiber mat
was suspended between the gaps between the
4. Results and discussion printed struts, as shown in Figure 3C and D,
leading to light loss caused by light reflection
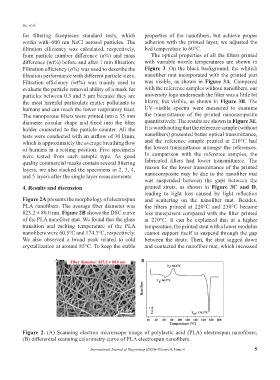
Figure 2A presents the morphology of electrospun and scattering on the nanofiber mat. Besides,
PLA nanofibers. The average fiber diameter was the filters printed at 220°C and 230°C became
825.2 ± 80.0 nm. Figure 2B shows the DSC curve less transparent compared with the filter printed
of the PLA nanofiber mat. We found that the glass at 210°C. It can be explained that at a higher
transition and melting temperature of the PLA temperature, the printed strut with a lower modulus
nanofibers were 60.5°C and 174.3°C, respectively. cannot support itself to suspend through the gap
We also observed a broad peak related to cold between the struts. Then, the strut sagged down
crystallization at around 85°C. To keep the stable and contacted the nanofiber mat, which increased
A B
Figure 2. (A) Scanning electron microscope image of polylactic acid (PLA) electrospun nanofibers;
(B) differential scanning calorimetry curve of PLA electrospun nanofibers.
International Journal of Bioprinting (2020)–Volume 6, Issue 4 5