
Page 283 - IJB-10-6
P. 283
International Journal of Bioprinting Skin bioprinting: Keratinocytes and stem cells
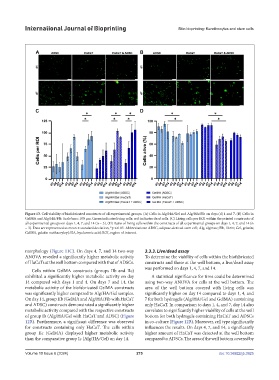
Figure 13. Cell viability of biofabricated constructs of all experimental groups. (A) Cells in Alg/HA/Gel and Alg/HA/Fib on days (d) 1 and 7. (B) Cells in
GelMA and Alg/HA/Fib. Scale bars: 100 μm. Green indicates living cells; red indicates dead cells. (C) Living cells per ROI within the printed constructs of
all experimental groups on days 1, 4, 7, and 14 (n = 3). (D) Ratio of living cells within the constructs of all experimental groups on days 1, 4, 7, and 14 (n
= 3). Data are represented as mean ± standard deviation; *p ≤ 0.05. Abbreviations: ADSC, adipose-derived stem cell; Alg, alginate; Fib, fibrin; Gel, gelatin;
GelMA, gelatin methacryloyl; HA, hyaluronic acid; ROI, region of interest.
morphology (Figure 11C). On days 4, 7, and 14 two-way 3.3.3. Live/dead assay
ANOVA revealed a significantly higher metabolic activity To determine the viability of cells within the biofabricated
of HaCaTs at the well bottom compared with that of ADSCs. constructs and those at the well bottom, a live/dead assay
was performed on days 1, 4, 7, and 14.
Cells within GelMA constructs (groups IIb and IIc)
exhibited a significantly higher metabolic activity on day A statistical significance for time could be determined
14 compared with days 1 and 4. On days 7 and 14, the using two-way ANOVA for cells at the well bottom. The
metabolic activity of the biofabricated GelMA constructs area of the well bottom covered with living cells was
was significantly higher compared to Alg/HA/Gel samples. significantly higher on day 14 compared to days 1, 4, and
On day 14, group IIb (GelMA and Alg/HA/Fib with HaCaT 7 for both hydrogels (Alg/HA/Gel and GelMA) containing
and ADSC) constructs demonstrated a significantly higher only HaCaT. In comparison to days 1, 4, and 7, day 14 also
metabolic activity compared with the respective constructs correlates to significantly higher viability of cells at the well
of group Ib (Alg/HA/Gel with HaCaT and ADSC) (Figure bottom for both hydrogels containing HaCaT and ADSCs
12B). Furthermore, a significant difference was observed in co-culture (Figure 12B). Moreover, cell type significantly
for constructs containing only HaCaT. The cells within influences the results. On days 4, 7, and 14, a significantly
group IIc (GelMA) displayed higher metabolic activity higher amount of HaCaT was detected at the well bottom
than the comparative group Ic (Alg/HA/Gel) on day 14. compared to ADSCs. The area of the well bottom covered by
Volume 10 Issue 6 (2024) 275 doi: 10.36922/ijb.3925