
Page 389 - IJB-10-6
P. 389
International Journal of Bioprinting Innovative manufacturing of ω-3-enriched chocolate
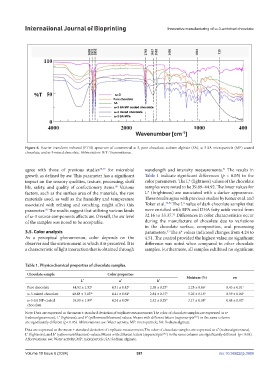
Figure 6. Fourier transform infrared (FTIR) spectrum of commercial ω-3, pure chocolate, sodium alginate (SA), ω-3-SA microparticle (MP)-coated
chocolate, and ω-3-mixed chocolate. Abbreviation: % T: Transmittance.
agree with those of previous studies 48,49 for microbial wavelength and intensity measurements. The results in
51
growth as defined by aw. This parameter has a significant Table 1 indicate significant differences (p < 0.05) in the
impact on the sensory qualities, texture, processing, shelf color parameters. The L* (lightness) values of the chocolate
life, safety, and quality of confectionery items. Various samples were noted to be 39.89–44.92. The lower values for
49
factors, such as the surface area of the materials, the raw L* (brightness) are associated with a darker appearance.
materials used, as well as the humidity and temperature These results agree with previous studies by Konar et al. and
associated with refining and conching, might affect this Toker et al. 49,52 The L* value of dark chocolate samples that
parameter. The results suggest that utilizing various kinds were enriched with EPA and DHA fatty acids varied from
50
52
of ω-3 source components affects aw. Overall, the aw level 32.16 to 33.37. Differences in color characteristics occur
of the samples was noted to be acceptable. during the manufacture of chocolate due to variations
in the chocolate surface, composition, and processing
3.5. Color analysis parameters. The a* values indicated changes from 4.24 to
53
As a perceptual phenomenon, color depends on the 4.51. The control provided the highest value; no significant
observer and the environment in which it is perceived. It is difference was noted when compared to other chocolate
a characteristic of light interaction that is obtained through samples. Furthermore, all samples exhibited no significant
Table 1. Physicochemical properties of chocolate samples.
Chocolate sample Color properties
Moisture (%) aw
L * a * b *
Pure chocolate 44.92 ± 1.52 a 4.51 ± 0.42 a 2.38 ± 0.25 b 2.25 ± 0.06 c 0.43 ± 0.01 c
ω-3-mixed chocolate 40.88 ± 3.03 ab 4.41 ± 0.64 a 2.84 ± 0.37 b 5.26 ± 0.18 a 0.59 ± 0.04 a
ω-3-SA NP-coated 39.89 ± 1.99 b 4.24 ± 0.09 a 2.52 ± 0.29 b 3.17 ± 0.08 b 0.48 ± 0.02 b
chocolate
Note: Data are expressed as the mean ± standard deviation of triplicate measurement; The color of chocolate samples are expressed as a*
(redness/greenness), L (lightness), and b (yellowness/blueness) values; Means with different letters (superscripts a,b,c ) in the same column
*
*
are significantly different (p< 0.05). Abbreviations: aw: Water activity; MP: microparticle; SA: Sodium alginate.
Data are expressed as the mean ± standard deviation of triplicate measurement; The color of chocolate samples are expressed as a (redness/greenness),
*
L (lightness), and b (yellowness/blueness) values; Means with different letters (superscripts a,b,c ) in the same column are significantly different (p< 0.05).
*
*
Abbreviations: aw: Water activity; MP: microparticle; SA: Sodium alginate.
Volume 10 Issue 6 (2024) 381 doi: 10.36922/ijb.3969