
Page 385 - IJB-10-6
P. 385
International Journal of Bioprinting Innovative manufacturing of ω-3-enriched chocolate
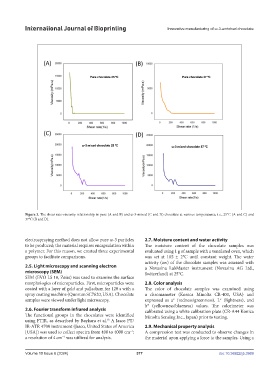
Figure 3. The shear rate-viscosity relationship in pure (A and B) and ω-3-mixed (C and D) chocolate at various temperatures, i.e., 25°C (A and C) and
37°C (B and D).
electrospraying method does not allow pure ω-3 particles 2.7. Moisture content and water activity
to be produced; the material requires encapsulation within The moisture content of the chocolate samples was
a polymer. For this reason, we created three experimental evaluated using 1 g of sample with a ventilated oven, which
groups to facilitate comparisons. was set at 105 ± 2°C until constant weight. The water
activity (aw) of the chocolate samples was assessed with
2.5. Light microscopy and scanning electron a Novasina LabMaster instrument (Novasina AG Ltd.,
microscopy (SEM) Switzerland) at 25°C.
SEM (EVO LS 10, Zeiss) was used to examine the surface
morphologies of microparticles. First, microparticles were 2.8. Color analysis
coated with a layer of gold and palladium for 120 s with a The color of chocolate samples was examined using
spray coating machine (Quorum SC7620, USA). Chocolate a chromameter (Konica Minolta CR-400, USA) and
samples were viewed under light microscopy. expressed as a* (redness/greenness), L* (lightness), and
b* (yellowness/blueness) values. The colorimeter was
2.6. Fourier transform infrared analysis calibrated using a white calibration plate (CR-A44 Konica
The functional groups in the chocolates were identified Minolta Sensing Inc., Japan) prior to testing.
using FTIR, as described by Baykara et al. A Jasco FT/
28
IR-ATR 4700 instrument (Jasco, United States of America 2.9. Mechanical property analysis
[USA]) was used to collect spectra from 400 to 4000 cm ; A compression test was conducted to observe changes in
−1
a resolution of 4 cm was utilized for analysis. the material upon applying a force to the samples. Using a
−1
Volume 10 Issue 6 (2024) 377 doi: 10.36922/ijb.3969