
Page 390 - IJB-10-6
P. 390
International Journal of Bioprinting Innovative manufacturing of ω-3-enriched chocolate
differences in the b* value. According to these findings, suggest that different types of loading, such as ω-3-mixed
the L* value was associated as a color indicator since the chocolate and ω-3-SA MP, could decrease strain values
a* and b* values did not give any distinction among the compared to pure chocolate scaffolds.
chocolate samples (p > 0.05). Similar results were obtained
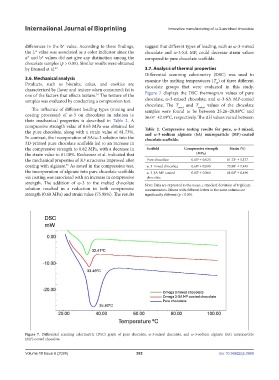
by Erunsal et al. 47 3.7. Analysis of thermal properties
Differential scanning calorimetry (DSC) was used to
3.6. Mechanical analysis examine the melting temperatures (T ) of three different
m
Products, such as biscuits, cakes, and cookies are chocolate groups that were evaluated in this study.
characterized by flavor and texture when consumed; fat is
one of the factors that affects texture. The texture of the Figure 7 displays the DSC thermogram values of pure
54
samples was evaluated by conducting a compression test. chocolate, ω-3-mixed chocolate, and ω-3-SA MP-coated
chocolate. The T and T values of the chocolate
endset
onset
The influence of different loading types (mixing and samples were found to be between 25.26–28.88°C and
coating processes) of ω-3 on chocolates in relation to 36.07–42.19°C, respectively. The ΔH values varied between
their mechanical properties is described in Table 2. A
compressive strength value of 0.65 MPa was obtained for Table 2. Compressive testing results for pure, ω-3-mixed,
the pure chocolate, along with a strain value of 81.73%. and ω-3-sodium alginate (SA) microparticle (MP)-coated
In contrast, the incorporation of SA/ω-3 solution into the chocolate scaffolds.
3D-printed pure chocolate scaffolds led to an increase in
the compressive strength to 0.82 MPa, with a decrease in Scaffold Compressive strength Strain (%)
the strain value to 61.08%. Keshavarz et al. indicated that (MPa)
the mechanical properties of 3D structures improved after Pure chocolate 0.65 ± 0.025 81.73 ± 3.377
c
a
coating with alginate. As noted in the compression test, ω-3-mixed chocolate 0.60 ± 0.003 75.98 ± 7.445
55
a
c
the incorporation of alginate into pure chocolate scaffolds ω-3-SA MP coated 0.82 ± 0.064 61.08 ± 8.496
b
b
via coating was associated with an increase in compressive chocolate
strength. The addition of ω-3 to the melted chocolate Note: Data are expressed as the mean ± standard deviation of triplicate
solution resulted in a reduction in both compressive measurements. Means with different letters in the same column are
strength (0.60 MPa) and strain value (75.98%). The results significantly different (p < 0.05).
Figure 7. Differential scanning calorimetric (DSC) graph of pure chocolate, ω-3-mixed chocolate, and ω-3-sodium alginate (SA) microparticle
(MP)-coated chocolate.
Volume 10 Issue 6 (2024) 382 doi: 10.36922/ijb.3969