
Page 425 - IJB-10-6
P. 425
International Journal of Bioprinting 3D-bioprinted respiratory disease model
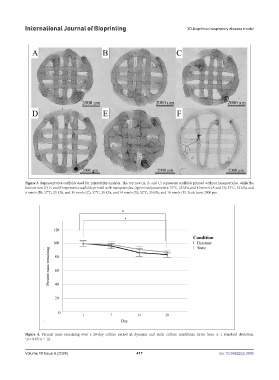
Figure 3. Representative scaffolds used for printability analysis. The top row (A, B, and C) represents scaffolds printed without nanoparticles, while the
bottom row (D, E, and F) represents scaffolds printed with nanoparticles. Optimized parameters: 37°C, 25 kPa, and 10 mm/s (A and D); 37°C, 22 kPa, and
6 mm/s (B); 27°C, 25 kPa, and 10 mm/s (C); 37°C, 28 kPa, and 14 mm/s (E); 32°C, 25 kPa, and 10 mm/s (F). Scale bars: 2000 µm.
*
Figure 4. Percent mass remaining over a 28-day culture period in dynamic and static culture conditions. Error bars: ± 1 standard deviation.
Figure 4. Percent mass remaining over a 28-day culture period in dynamic and static culture
*p < 0.05; n = 12.
conditions. Error bars: ± 1 standard deviation. *p < 0.05; n = 12.
Volume 10 Issue 6 (2024) 417 doi: 10.36922/ijb.3895
37