
Page 456 - IJB-10-6
P. 456
International Journal of Bioprinting 3D-printed scaffold for biomolecule delivery
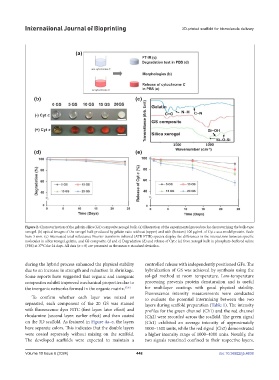
Figure 2. Characterization of the gelatin-silica (GS) composite xerogel bulk. (a) Illustration of the experimental procedure for characterizing the bulk-type
xerogel. (b) optical images of the xerogel bulk produced by gelatin ratio without (upper) and with (bottom) 100 μg/mL of Cyt c as a model protein. Scale
bars: 5 mm. (c) Attenuated total reflectance Fourier transform infrared (ATR FTIR) spectra display the differences in the interactions between specific
molecules in silica xerogel, gelatin, and GS composite. (d and e) Degradation (d) and release of Cyt c (e) from xerogel bulk in phosphate-buffered saline
(PBS) at 37°C for 24 days. All data (n = 8) are presented as the mean ± standard deviation.
during the hybrid process enhanced the physical stability controlled release with independently positioned GFs. The
due to an increase in strength and reduction in shrinkage. hybridization of GS was achieved by synthesis using the
Some reports have suggested that organic and inorganic sol-gel method at room temperature. Low-temperature
composites exhibit improved mechanical properties due to processing prevents protein denaturation and is useful
the inorganic networks formed in the organic matrix. 37,43 for multilayer coatings with good physical stability.
Fluorescence intensity measurements were conducted
To confirm whether each layer was mixed or to evaluate the potential intermixing between the two
separated, each component of the 20 GS was stained layers during scaffold preparation (Table 1). The intensity
with fluorescence dyes FITC (first layer: later effect) and profiles for the green channel (Ch1) and the red channel
rhodamine (second layer: earlier effect) and then coated (Ch2) were recorded across the scaffold. The green signal
on the 3D scaffold. As featured in Figure 4a–e, the layers (Ch1) exhibited an average intensity of approximately
have separate colors. This indicates that the double layers 1000–1500 units, while the red signal (Ch2) demonstrated
were coated separately without mixing on the scaffold. a higher intensity range of 1000–4000 units. Notably, the
The developed scaffolds were expected to maintain a two signals remained confined to their respective layers,
Volume 10 Issue 6 (2024) 448 doi: 10.36922/ijb.4638