
Page 509 - IJB-10-6
P. 509
International Journal of Bioprinting Redefined collagen inks in cartilage printing
analysis (GSEA). Curated gene sets from the (molecular 3. Results and discussion
signature database of the Broad Institute) for cartilage 3.1. Characterization of the extract
development and chondrocyte development (GOBP_ The quality of the extracted collagen was ascertained by
CHONDROCYTE_DEVELOPMENT, M11483, and Coomassie-stained SDS-PAGE, DSC, and hydroxyproline
GOBP_CARTILAGE_DEVELOPMENT, M10512) were assay (Figure S1, Supporting Information). The
used to assess chondrogenesis and compare between cells electrophoretogram contains typical collagen type I
printed in pure collagen and biofunctionalized collagen bands around 115–120 kDa, corresponding to the α1 and
of genes with >1.5-fold change expression compared to α2 chains, and two bands at >200 kDa, attributed to β
2D control (SVF cells grown under standard monolayer dimers. The thermogram also contains a typical narrow
37
conditions) and <0.05 false discovery rate (FDR) adjusted endothermic transition centered at 41.6°C. The total
35
p-value. Gene ontology (GO) analyses with ShinyGO 0.80 collagen content is >90% of the dry mass.
and StringDB were used with upregulated genes, while
36
Venny 2.1 (https://bioinfogp.cnb.csic.es/tools/venny/) was 3.2. Kinetics of thermal crosslinking and
hydrogel properties
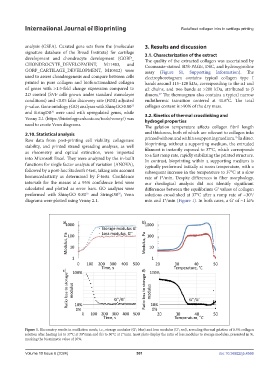
used to create Venn diagrams. The gelation temperature affects collagen fibril length
2.10. Statistical analysis and thickness, both of which are relevant to collagen inks
25
Raw data from post-printing cell viability, collagenase printed without and within a supporting medium. In direct
stability, and printed strand spreading analyses, as well bioprinting, without a supporting medium, the extruded
as rheometry and optical extinction, were imported filament is instantly exposed to 37°C, which corresponds
to a fast ramp rate, rapidly stabilizing the printed structure.
into Microsoft Excel. They were analyzed by the in-built In contrast, bioprinting within a supporting medium is
functions for single factor analysis of variation (ANOVA), typically performed initially at room temperature, with a
followed by a post-hoc Student’s t-test, taking into account subsequent increase in the temperature to 37°C at a slow
homoscedasticity as determined by F-tests. Confidence rate of 1°/min. Despite differences in fiber morphology,
intervals for the means at a 95% confidence level were our rheological analysis did not identify significant
calculated and plotted as error bars. GO analyses were differences between the equilibrium Gʹ values of collagen
36
35
performed with ShinyGO 0.80 and StringDB ; Venn solutions crosslinked at 37°C after a ramp rate of ~30°/
diagrams were plotted using Venny 2.1. min and 1°/min (Figure 1). In both cases, a Gʹ of ~1 kPa
Figure 1. Rheometry results in oscillation mode, i.e., storage modulus (Gʹ; blue) and loss modulus (Gʹ; red), revealing thermal gelation of 0.5% collagen
solution after heating (a) to 37°C at 30°/min and (b) to 50°C at 1°/min. Inset plots display the ratio of loss modulus to storage modulus, presented in %,
marking the biomimetic value of 10%.
Volume 10 Issue 6 (2024) 501 doi: 10.36922/ijb.4566