
Page 511 - IJB-10-6
P. 511
International Journal of Bioprinting Redefined collagen inks in cartilage printing
maximum inhibition at 200 mM. At a concentration range is reproduced in the collagen gels (insets of Figure 1),
44
of 5–30 mM, common in low- and high-glucose media, mirroring the viscoelastic properties of natural cartilage
we observed negligible differences in gelation kinetics and indicating an optimal balance between viscosity
with largely overlapping Gʹ(t) curves across glucose and elasticity. This balance is essential for supporting
concentrations (Figure S2c, Supporting Information), cellular functions, such as proliferation, differentiation,
suggesting that PBS mitigates its inhibitory effect. and migration, providing an ideal ECM-simulating
A collagen ink with subphysiological ionic strength will environment for bioprinted cells.
impose stress on cells already subjected to shear stresses We performed in situ rheological analysis during
during the extrusion. To assess its impact on cell viability thermal crosslinking with a ramp rate of 1°/min, and we
and proliferation during bioprinting, as initial tests, we report the storage moduli Gʹ achieved at 37°C for collagen
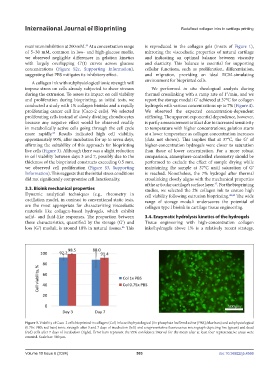
conducted a study with 1% collagen bioinks and a rapidly hydrogels with various concentrations up to 7% (Figure 4).
proliferating cancer cell line (Caco-2 cells). We selected We observed the expected concentration-dependent
proliferating cells instead of slowly dividing chondrocytes stiffening. The apparent exponential dependence, however,
because any negative effect would be observed readily is partly a measurement artifact due to increased sensitivity
in metabolically active cells going through the cell cycle to temperature with higher concentrations; gelation starts
45
more rapidly. Results indicated high cell viability, at a lower temperature as collagen concentration increases
approximately 90%, after incubation for up to seven days, (data not shown). This implies that at 37°C, the Gʹ of
affirming the suitability of this approach for bioprinting higher-concentration hydrogels were closer to saturation
live cells (Figure 3). Although there was a slight reduction than those of lower concentration. For a more robust
in cell viability between days 3 and 7, possibly due to the comparison, atmosphere-controlled rheometry should be
thickness of the bioprinted constructs exceeding 0.5 mm, performed to exclude the effect of sample drying while
we observed cell proliferation (Figure S3, Supporting maintaining the sample at 37°C until saturation of Gʹ
Information). This suggests that the initial stress conditions is reached. Nonetheless, the 7% hydrogel after thermal
did not significantly compromise cell functionality. crosslinking closely aligns with the mechanical properties
of the articular cartilage’s surface layer. . For the bioprinting
47
3.3. Bioink mechanical properties studies, we selected the 2% collagen ink to ensure high
Dynamic analytical techniques (e.g., rheometry in cell viability following extrusion bioprinting. 48,49 The wide
oscillation mode), in contrast to conventional static tests, range of storage moduli underscores the potential of
are the most appropriate for characterizing viscoelastic collagen type I bioink in cartilage tissue engineering.
materials like collagen-based hydrogels, which exhibit
solid- and fluid-like responses. The proportion between 3.4. Enzymatic hydrolysis kinetics of the hydrogels
these characteristics, quantified by the storage (Gʹ) and Tissue engineering with high-concentration collagen
loss (Gʹ) moduli, is around 10% in natural tissues. This inks/hydrogels above 1% is a relatively recent strategy,
46
Figure 3. Viability of Caco-2 cells bioprinted in collagen (Col) inks with physiological (1× phosphate-buffered saline [PBS]; blue bars) and subphysiological
(0.75× PBS; red bars) ionic strength after 3 and 7 days of incubation (left) and a representative fluorescence micrograph depicting live (green) and dead
(red) cells after 7 days of incubation (right). Error bars represent the 95% confidence interval for the mean after at least four representative areas were
counted. Scale bar: 500 μm.
Volume 10 Issue 6 (2024) 503 doi: 10.36922/ijb.4566