
Page 515 - IJB-10-6
P. 515
International Journal of Bioprinting Redefined collagen inks in cartilage printing
Notably, error bars are deliberately omitted from the bioprinting experiments, suggests a strong immobilization
cumulative values reported in Figure 8 to avoid misleading of the GF. At this significantly lower concentration, release
the reader. One of the reasons is that the concentration may be slower or less evident due to weaker concentration
of TGF-β1 was determined in freshly added PBS, i.e., gradients and stronger interactions with hydrogel
its statistically significant detection in the supernatant molecules. To our knowledge, this is the first demonstration
(n = 3; α = 0.05) up to and including day 7 is proof of GF of an efficient TGF-β1 sequestration within a collagen
release. The calculated values are then summed, and the hydrogel, highlighting its potential for sustained delivery
relative concentration is plotted. The second reason is to embedded cells in bioprinted tissue engineering. 51
that the values may systematically underestimate the true
concentration due to the impact of freezing the supernatant 3.7. Biological effects of collagen I-based
containing the released GF. A preliminary study indicated and collagen I-biofunctionalized hydrogels
that absorbance values can halve when a solution on chondrogenesis
containing 312.5 pg/mL TGF-β1 is frozen at −20°C for 2 h, To assess the potential use of collagen I-based bioinks
compared to the same solution maintained at 4°C without in cartilage tissue engineering, we first tested the
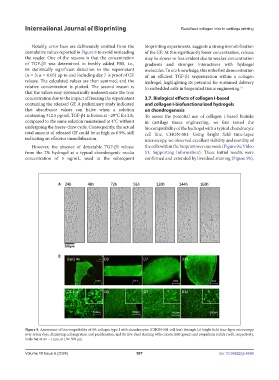
undergoing the freeze-thaw cycle. Consequently, the actual biocompatibility of the hydrogel with a typical chondrocyte
total amount of released GF could be as high as 0.9%, still cell line, CHON-001. Using bright field time-lapse
indicating an effective immobilization. microscopy, we observed excellent viability and motility of
However, the absence of detectable TGF-β1 release the cells within the bioprint over one week (Figure 9a; Video
from the 2% hydrogel at a typical chondrogenic media S1, Supporting Information). These initial results were
concentration of 5 ng/mL, used in the subsequent confirmed and extended by live/dead staining (Figure 9b),
Figure 9. Assessment of biocompatibility of 1% collagen type I with chondrocytes (CHON-001 cell line) through (a) bright field time-lapse microscopy
over seven days, displaying cell migration and proliferation, and (b) live-dead staining with calcein AM (green) and propidium iodide (red), respectively.
Scale bar at 4× – 1mm, at 10× 500 µm.
Volume 10 Issue 6 (2024) 507 doi: 10.36922/ijb.4566