
Page 86 - IJB-7-1
P. 86
Biodegradation, Antibacterial Performance and Cytocompatibility of SMLed ZK30-Cu-Mn
A B
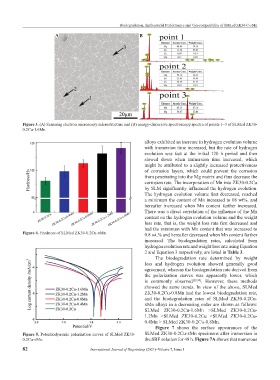
Figure 3. (A) Scanning electron microscopy microstructure and (B) energy-dispersive spectroscopy spectra of points 1~3 of SLMed ZK30-
0.2Cu-1.6Mn.
alloys exhibited an increase in hydrogen evolution volume
with immersion time increased, but the rate of hydrogen
evolution was fast at the initial 120 h period and then
slowed down when immersion time increased, which
might be attributed to a slightly increased protectiveness
of corrosion layers, which could prevent the corrosion
from penetrating into the Mg matrix and thus decrease the
corrosion rate. The incorporation of Mn into ZK30-0.2Cu
by SLM significantly influenced the hydrogen evolution.
The hydrogen evolution volume first decreased, reached
a minimum the content of Mn increased to 08 wt%, and
hereafter increased when Mn content further increased.
There was a direct correlation of the influence of the Mn
content on the hydrogen evolution volume and the weight
loss rate, that is, the weight loss rate first decreased and
had the minimum with Mn content that was increased to
Figure 4. Hardness of SLMed ZK30-0.2Cu-xMn. 0.8 wt.% and hereafter decreased when Mn content further
increased. The biodegradation rates, calculated from
hydrogen evolution rate and weight loss rate using Equation
2 and Equation 3 respectively, are listed in Table 3.
The biodegradation rate determined by weight
loss and hydrogen evolution showed generally good
agreement, whereas the biodegradation rate derived from
the polarization curves was apparently lower, which
is commonly observed [29,30] . However, these methods
showed the same trends. In view of the above, SLMed
ZK30-0.2Cu-0.8Mn had the lowest biodegradation rate,
and the biodegradation rates of SLMed ZK30-0.2Cu-
xMn alloys in a decreasing order are shown as follows:
SLMed ZK30-0.2Cu-1.6Mn >SLMed ZK30-0.2Cu-
1.2Mn >SLMed ZK30-0.2Cu >SLMed ZK30-0.2Cu-
0.4Mn > SLMed ZK30-0.2Cu-0.8Mn.
Figure 7 shows the surface appearances of the
Figure 5. Potentiodynamic polarization curves of SLMed ZK30- SLMed ZK30-0.2Cu-xMn specimens after immersion in
0.2Cu-xMn. the SBF solution for 48 h. Figure 7A shows that numerous
82 International Journal of Bioprinting (2021)–Volume 7, Issue 1