
Page 88 - IJB-7-1
P. 88
Biodegradation, Antibacterial Performance and Cytocompatibility of SMLed ZK30-Cu-Mn
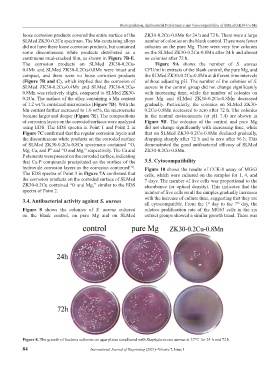
loose corrosion products covered the entire surface of the ZK30-0.2Cu-0.8Mn for 24 h and 72 h. There were a large
SLMed ZK30-0.2Cu specimen. The Mn-containing alloys number of colonies on the blank control. There were fewer
did not have these loose corrosion products, but contained colonies on the pure Mg. There were very few colonies
some discontinuous white products distributed as a on the SLMed ZK30-0.2Cu-0.8Mn after 24 h and almost
continuous mud-cracked film, as shown in Figure 7B-E. no colonies after 72 h.
The corrosion products on SLMed ZK30-0.2Cu- Figure 9A shows the number of S. aureus
0.4Mn and SLMed ZK30-0.2Cu-0.8Mn were intact and CFU/ml in extracts of the blank control, the pure Mg, and
compact, and there were no loose corrosion products the SLMed ZK30-0.2Cu-0.8Mn at different time intervals
(Figure 7B and C), which implied that the corrosion of without adjusting pH. The number of the colonies of S.
SLMed ZK30-0.2Cu-0.4Mn and SLMed ZK30-0.2Cu- aureus in the control group did not change significantly
0.8Mn was relatively slight, compared to SLMed ZK30- with increasing time, while the number of colonies on
0.2Cu. The surface of the alloy containing a Mn content pure Mg and SLMed ZK30-0.2Cu-0.8Mn decreased
of 1.2 wt.% contained microcracks (Figure 7D). With the gradually. Particularly, the colonies on SLMed ZK30-
Mn content further increased to 1.6 wt%, the microcracks 0.2Cu-0.8Mn decreased to zero after 72 h. The colonies
became larger and deeper (Figure 7E). The compositions in the neutral environments (at pH 7.4) are shown in
of corrosion layers on the corroded surfaces were analyzed Figure 9B. The colonies of the control and pure Mg
using EDS. The EDS spectra in Point 1 and Point 2 in did not change significantly with increasing time, while
Figure 7C confirmed that the regular corrosion layers and that on SLMed ZK30-0.2Cu-0.8Mn declined gradually,
the discontinuous white products on the corroded surface dropping sharply after 72 h and to zero after 96 h. This
of SLMed ZK30-0.2Cu-0.8Cu specimens contained “O, demonstrated the good antibacterial efficacy of SLMed
Mg, Ca, and P” and “O and Mg,” respectively. The Ca and ZK30-0.2Cu-0.8Mn.
P elements were present on the corroded surface, indicating
that Ca-P compounds precipitated on the surface of the 3.5. Cytocompatibility
hydroxide corrosion layers as the corrosion continued . Figure 10 shows the results of CCK-8 assay of MG63
[31]
The EDS spectra of Point 3 in Figure 7A confirmed that cells, which were cultured on the samples for 1, 4, and
the corrosion products on the corroded surface of SLMed 7 days. The number of live cells was proportional to the
ZK30-0.2Cu contained “O and Mg,” similar to the EDS absorbance (or optical density). This indicates that the
spectra of Point 2. number of live cells on all the samples gradually increases
3.4. Antibacterial activity against S. aureus with the increase of culture time, suggesting that they are
all cytocompatible. From the 1 day to the 7 day, the
th
st
Figure 8 shows the colonies of S. aureus cultured relative proliferation rate of the MG63 cells in the six
on the blank control, on pure Mg and on SLMed extract groups showed a similar growth trend. There was
Figure 8. The growth of bacteria colonies on agar plates cocultured with Staphylococcus aureus at 37°C for 24 h and 72 h.
84 International Journal of Bioprinting (2021)–Volume 7, Issue 1