
Page 62 - IJB-7-2
P. 62
3D Bioprinted Triple-layered Human Alveolar Lung Models
of 0.75 million cells/ml to create a sparsely distributed the EA.hy926 endothelial cells (2 x 10 cells/ml), the printed
6
fibroblast layer. Notably, the MRC5 fibroblasts utilized cell output per droplet showed small fluctuations from 62.5
in this study were observed to form large cell clumps ± 5.6 cells per droplet at 0-min interval to 64.1 ± 4.8 cells
over time and this led to the clogging of printhead with a per droplet at 30-min interval. The printed cell output per
nozzle diameter of 100 µm after 25 min of cell printing. droplet for MRC5 fibroblasts (0.75 x 10 cells/ml) also shows
6
The clogging issue for the MRC5 fibroblasts can be negligible fluctuation from 18.4 ± 5.9 cells per droplet at
mitigated by using a larger nozzle diameter of 300 µm 0-min interval to 19.1 ± 4.4 cells per droplet at 30-min interval.
and this was used to print the different human alveolar Hence, the use of 2.5% w/v PVP-modified cell suspension
lung cells for all subsequent experiments in this study. and a larger nozzle diameter of 300 µm facilitates the printing
The modified PVP-based cell suspensions are first of different human alveolar lung cells (A549 epithelial cells,
loaded into printing cartridges and allowed to reach an EA.hy926 endothelial cells, and MRC5 fibroblasts) with high
equilibrium for 5 min before printing. The printed cell output consistency over a period of 30 min (Figure 2A and B).
per droplet for A549 epithelial cells (2 x 10 cells/ml) showed Next, the initial viability of the printed cells is
6
small fluctuation from 59.7 ± 5.1 cells per droplet at 0-min compared against the control non-printed cells. The
interval to 60.8 ± 5.3 cells per droplet at 30-min interval. For Molecular Probes Live/Dead staining kit stains the
®
A
B C
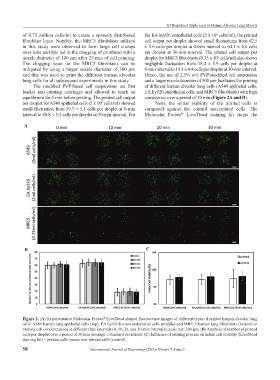
Figure 2. (A) Representative Molecular Probes Live/Dead stained fluorescence images of different types of printed human alveolar lung
®
cells: A549 human lung epithelial cells (top), EA.hy926 human endothelial cells (middle) and MRC-5 human lung fibroblasts (bottom) at
varying cell concentrations at different time intervals (0, 10, 20, and 30-min intervals); scale bar: 200 µm. (B) Analysis of number of printed
cells per droplet over a period of 30 min (average ± standard deviation). (C) Influence of printing process on initial cell viability (Live/Dead
staining kit) – printed cells versus non-printed cells (control).
58 International Journal of Bioprinting (2021)–Volume 7, Issue 2