
Page 63 - IJB-7-2
P. 63
Ng, et al.
viable cells green and the dead cells red. The initial cell The number of viable cells at any given time point can be
viability of printed cells (A549, EA.hy926, and MRC5) measured and expressed in terms of relative fluorescent
is as follows: 97.1 ± 1.4%, 97.1 ± 1.5%, and 97.4 ± 2.6%, units (RFUs) from the fluorescence readout. The RFUs
respectively, while the initial cell viability of control non- are normalized with respect to day 1 for each type of
printed cells (A549, EA.hy926, and MRC5) is as follows: cells (both printed and non-printed) for easy comparison
97.8 ± 0.8%, 98.0 ± 0.9%, and 98.0 ± 1.3% (Figure 2C). of long-term viability across different groups. In general,
Hence, the printing process has no significant effect on the the normalized RFUs for the printed cells are relatively
printed cells as compared to the control non-printed cells. similar to those control non-printed cells at different time
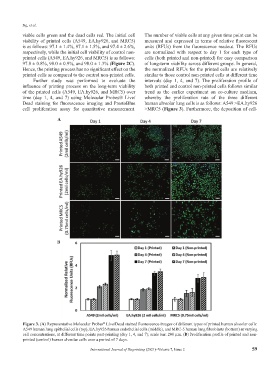
Further study was performed to evaluate the intervals (day 1, 4, and 7). The proliferation profile of
influence of printing process on the long-term viability both printed and control non-printed cells follows similar
of the printed cells (A549, EA.hy926, and MRC5) over trend as the earlier experiment on co-culture medium,
time (day 1, 4, and 7) using Molecular Probes® Live/ whereby the proliferation rate of the three different
Dead staining for fluorescence imaging and PrestoBlue human alveolar lung cells is as follows: A549 >EA.hy926
cell proliferation assay for quantitative measurement. >MRC5 (Figure 3). Furthermore, the deposition of cell-
A
B
Figure 3. (A) Representative Molecular Probes Live/Dead stained fluorescence images of different types of printed human alveolar cells:
®
A549 human lung epithelial cells (top), EA.hy926 human endothelial cells (middle), and MRC-5 human lung fibroblasts (bottom) at varying
cell concentrations, at different time points post-printing (day 1, 4, and 7); scale bar: 200 µm. (B) Proliferation profile of printed and non-
printed (control) human alveolar cells over a period of 7 days.
International Journal of Bioprinting (2021)–Volume 7, Issue 2 59