
Page 133 - IJB-7-3
P. 133
Rueda-Gensini, et al.
number of cells. Four different areas of each hydrogel for 3 h. The medium was then removed and fluorescence
were evaluated for statistical analysis. intensity was quantified with a FluoroMax® fluorometer
Cell morphology changes were assessed in SISMA (Horiba, Kyoto, Japan) at 560 nm excitation. Fresh
and SISMA-GO bioprinted constructs by staining F-actin culture medium was added to the assayed constructs to
filaments with AlexaFluor 488 Phalloidin and cell continue incubation until the next measurement.
TM
nuclei with Hoechst 3342 at day 0 and day 6. Briefly,
tissues were fixed with 10% (v/v) formalin for 30 min 2.14. Characterization of GO reduced in situ
and washed with 1× PBS 3 times to remove remnants of GO’s in situ reduction was confirmed with Fourier
formalin. Cell membranes were then permeabilized with Transform Infrared (FT-IR) spectroscopy and
a 0.25% (w/v) solution of Triton-X in 1× PBS for 5 min thermogravimetric analysis (TGA). Infrared spectra of
and subsequently washed 3 times with 1× PBS. Finally, graphite, GO, and rGO were recorded using an A250/D FT-
a working solution of AlexaFluor 488 Phalloidin and IR (Bruker, Germany) within the range of 4000 – 400 cm
TM
−1
Hoechst 3342 was prepared at a 1:400 and 1:1000 ratios and spectral resolution of 2 cm . The presence or absence
−1
in 1× PBS, respectively, and then added to the constructs of characteristic peaks of each material was analyzed
and incubated for 1 h. The stained constructs were to assess structural changes within these. TGA (TA
washed 3 times with 1× PBS and immediately visualized Instruments) was also performed on these three materials
with confocal microscopy using 488 nm and 358 nm from 30 to 800°C, with a temperature ramp of 10°C/min,
laser excitations, respectively. Five images at a 20× to compare thermal stability differences that may arise
magnification were captured and stacked from adjacent from structural defects within these. Sample masses of
Z-planes, separated by 2 µm each, and emission channels 5 mg were used for this analysis. Reduction was further
were overlapped. Similarly, single-cell morphology was confirmed with Raman spectroscopy (0 – 3000 Raman
−1
observed by capturing and stacking 45 images collected shift [cm ]) of the bioprinted constructs after 3 days of
at 60× magnification. incubation in DMEM culture medium supplemented with
Cell proliferation in SISMA and SISMA-GO 0.5 mM ascorbic acid at 37°C. The treated constructs were
constructs was also assayed by quantifying cell metabolic lyophilized to avoid noise by water presence during data
activity at days 0, 4, and 7 aided by a resazurin-based collection and point wise laser excitation of 532 nm was
assay (TOX8). Reduced resazurin by viable cells emits red performed at different locations within the samples.
fluorescence and, therefore, the amount of dye conversion
was fluorometrically measured. Accordingly, resazurin 2.15. Electroconductivity of GO reduced in situ
dye solution was added to the cell culture medium of each Since GO was incorporated at a low concentration
construct at a 10% (v/v) concentration and then incubated of 0.25 mg/mL, contacts between all GO sheets
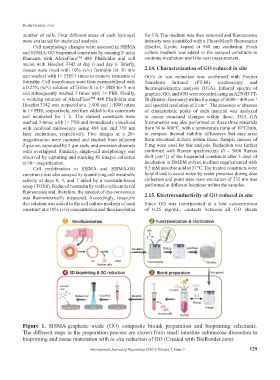
Figure 1. SISMA-graphene oxide (GO) composite bioink preparation and bioprinting schematic.
The different steps in the preparation process are shown from small intestine submucosa dissection to
bioprinting and tissue maturation with in situ reduction of GO (Created with BioRender.com).
International Journal of Bioprinting (2021)–Volume 7, Issue 3 129