
Page 200 - IJB-8-1
P. 200
3D Printing of a Graphene-Modified Photopolymer Using SLA
the potential application in biomedical field. Besides, completed. It was observed that the addition of G
wettability measurements can give information about significantly reduced the T value, from 106°C to 73°C.
g
layers adhesion since polymerized layer has to be wetted However, GO and GoxNP showed similar T than R
g
by liquid resin to obtain adequate adhesion between the (Table 1).
polymerized layer and the new one.
Hydrophilicity was studied by measuring the contact 4.2. Thermal polymerization
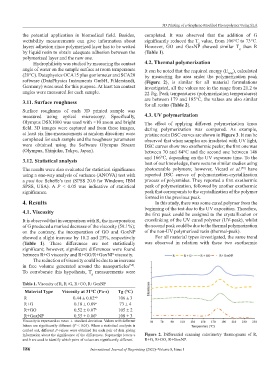
angle of water on the sample surface at room temperature It can be noted that the required energy (E ), calculated
total
(20°C). Dataphysics OCA15 plus goniometer and SCA20 by measuring the area under the polymerization peak
software (DataPhysics Instruments GmbH, Filderstandt, (Figure 2), is similar for all material formulations
Germany) were used for this purpose. At least ten contact investigated, all the values are in the range from 21.2 to
angles were measured for each sample. 22 J/g. Peak temperatures (polymerization temperatures)
are between 179 and 185°C, the values are also similar
3.11. Surface roughness for all resins (Table 2).
Surface roughness of each 3D printed sample was
measured using optical microscopy. Specifically, 4.3. UV polymerization
Olympus DSX1000 was used with ×10 zoom and bright The effect of applying different polymerization times
field. 3D images were captured and from these images, during polymerization was compared. As example,
at least six line-measurements at random directions were pristine resin DSC curves are shown in Figure 3. It can be
completed for each sample and the roughness parameters observed that when samples are irradiated with UV light,
were obtained using the Software Olympus Stream DSC curves show two exothermic peaks; the first one was
(Olympus, Shinjuku, Tokyo, Japan). between 70 and 84°C and the second one between 146
and 166°C, depending on the UV exposure time. To the
3.12. Statistical analysis best of our knowledge, there were no similar studies using
The results were also evaluated for statistical significance photocurable polymers; however, Vicard et al. have
[55]
using a one-way analysis of variance (ANOVA) test with reported DSC curves of polymerization-crystallization
a post hoc Scheffe’s test (SPSS 20.0 for Windows; IBM process of polyamides. They reported a first exothermic
SPSS, USA). A P < 0.05 was indicative of statistical peak of polymerization, followed by another exothermic
significance. peak that corresponds to the crystallization of the polymer
formed in the previous peak.
4. Results In this study, there was some cured polymer from the
beginning of the test due to the UV exposition. Therefore,
4.1. Viscosity the first peak could be assigned to the crystallization or
It is observed that in comparison with R, the incorporation crosslinking of the UV cured polymer (UV-peak), whilst
of G produced a marked decrease of the viscosity (59.1%); the second peak could be due to the thermal polymerization
on the contrary, the incorporation of GO and GoxNP of the non-UV polymerized resin (thermal-peak).
showed a slight increase by 18.2 and 25%, respectively For all material types investigated, the same trend
(Table 1). These differences are not statistically was observed in relation with these two exothermic
significant; however, significant differences were found
between R+G viscosity and R+GO/R+GoxNP viscosity.
The reduction of viscosity could be due to an increase
in free volume generated around the nanoparticles .
[54]
To corroborate this hypothesis, T measurements were
g
Table 1. Viscosity of R, R+G, R+GO, R+GoxNP
Material Type Viscosity at 31°C (Pa·s) Tg (°C)
R 0.44 ± 0.02 a,b 106 ± 3
R+G 0.18 ± 0.09 a 73 ± 4
R+GO 0.52 ± 0.07 b 105 ± 2
R+GoxNP 0.55 ± 0.06 b 108 ± 3
Viscosity is expressed as mean ± standard deviation. Values with different
letters are significantly different (P < 0.05). When a statistical analysis is
carried out, different P-values were obtained for each pair of data giving
information about the significance of the differences. Superscript letters a Figure 2. Differential scanning calorimetry thermograms of R,
and b are used to identify which pairs of values are significantly different. R+G, R+GO, R+GoxNP.
186 International Journal of Bioprinting (2022)–Volume 8, Issue 1