
Page 198 - IJB-8-1
P. 198
3D Printing of a Graphene-Modified Photopolymer Using SLA
example, type and specific surface area of the nanomaterial A B
– the latter factor affects the extents of shielding, which
can affect the degree of polymerization .
[48]
In this study, the effect of incorporating a
particular GBN (G, GO and GoxNP) into a commercial
photosensitive resin has been investigated. Specifically,
the thermal properties and the polymerization reaction
were investigated using Fourier transform infrared C
(FTIR) spectroscopy and differential scanning
calorimetry (DSC). The influence of GBN incorporation
into the polymer resin was also determined in terms of
rheological, physicochemical and surface properties, as
well as dimensional accuracy and printability following
3D printing.
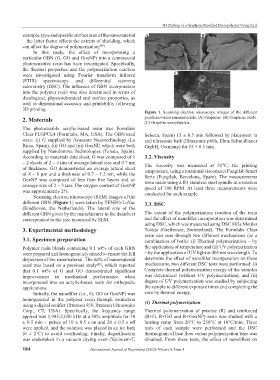
Figure 1. Scanning electron microscope images of the different
2. Materials graphene-based nanomaterials. (A) Graphene. (B) Graphene oxide.
(C) Graphite nanoplatelets.
The photocurable acrylic-based resin was Formlabs
Clear FLGPCL4 (Formlabs, MA, USA). The GBN used Selecta, Spain) 15 ± 0.5 min followed by placement in
were: (i) G supplied by Avanzare Nanotechnology (La and ultrasonic bath (Elmasonic p60h, Elma Schmidbauer
Rioja, Spain), (ii) GO and (iii) GoxNP, which were both GmbH, Germany) for 15 ± 0.5 min.
supplied by NanoInnova Technologies (Toledo, Spain).
According to materials data sheet, G was composed of 1 3.2. Viscosity
– 2 sheets of 2 – 4 µm of average lateral size and 0.7 nm The viscosity was measured at 31°C, the printing
of thickness. GO demonstrated an average lateral sheet temperature, using a rotational viscometer Fungilab Smart
of 4 – 8 µm and a thickness of 0.7 – 1.2 nm, while the Serie (Fungilab, Barcelona, Spain). The measurements
GoxNP was composed of less than five layers and an were made using a R3 stainless steel spindle at a rotation
average size of 2 – 3 µm. The oxygen content of GoxNP speed of 100 RPM. At least three measurements were
was approximately 2%. conducted for each sample.
Scanning electron microscope (SEM) images of the
different GBN (Figure 1) were taken by TENEO-LoVac 3.3. DSC
(Eindhoven, the Netherlands). The lateral size of the
different GBN given by the manufacturer in the datasheet The extent of the polymerization reaction of the resin
corresponded to the size measured by SEM. and the effect of nanofiller incorporation was determined
using DSC, which was measured using DSC 882e Mettler
3. Experimental methodology Toledo (Greifensee, Switzerland). The Formlabs Clear
resin can cure through two different mechanisms (or a
3.1. Specimen preparation combination of both): (i) Thermal polymerization – by
Polymer resin blends containing 0.1 wt% of each GBN the application of temperature and (ii) UV polymerization
were prepared and homogenously mixed to ensure the full – by the application of UV light at 405 nm wavelength. To
dispersion of the nanomaterial. The wt% of nanomaterial determine the effect of nanofiller incorporation on these
used was based on a previous study , which reported mechanisms, two different DSC tests were performed: (i)
[49]
that 0.1 wt% of G and GO demonstrated significant Complete thermal polymerization energy of the samples
improvement in mechanical performance when was determined (without UV polymerization), and (ii)
incorporated into an acrylic-based resin for orthopedic degree of UV polymerization was studied by subjecting
applications. the sample to different exposure times and completing the
Initially, the nanofiller (i.e., G, GO or GoxNP) was cure by thermal energy.
homogenized in the polymer resin through sonication (1) Thermal polymerization
using a digital sonifier (Branson 450, Branson Ultrasonics
Corp., CT, USA). Specifically, the frequency range Thermal polymerization of pristine (R) and reinforced
applied was 1,985-2,050 kHz at a 30% amplitude for 30 (R+G, R+GO and R+GoxNP) resin was studied with a
± 0.5 min – pulses of 10 ± 0.5 s on and 20 ± 0.5 s off heating ramp from 20°C to 250°C at 10°C/min. Three
were applied, and the solution was placed in an ice bath tests of each sample were performed and the DSC
(6 ± 2°C) to avoid overheating. Finally, degasification thermogram of heat flow versus polymerization time was
was undertaken in a vacuum drying oven (Vaciotem-T, obtained. From these tests, the effect of nanofillers on
184 International Journal of Bioprinting (2022)–Volume 8, Issue 1