
Page 203 - IJB-8-1
P. 203
Lopez de Armentia, et al.
Therefore, Shore D hardness was lower for these GBN. structure to be properly formed. This could be due to a
Whilst hardness value of R was 82 after 60 min of exposure decrease in curing depth, leading to a lack of adhesion
time, R+G and R+GoxNP were 67 and 71, respectively. between layers when G is present. It could be related
However, GO did not change the polymerization degree with the retardation in the UV polymerization previously
of resin – with a Shore D hardness of 81 after 60 min. discussed.
4.4. UV-visible spectroscopy (1) Dimensional stability
To determine if the presence of the nanofillers affects Tables 6 and 7 show dimensional stability of the
the UV absorption, the absorbance of the different different samples. R+G samples are not included in this
uncured samples was measured by means of UV-visible analysis because the printed samples did not demonstrate
spectroscopy. Wavelength was set at 405 nm, which was sufficient quality. Difference images – designed geometry
the same wavelength used by the printer. Results are versus printed geometry – were obtained by subtracting
shown in Table 5. the reference image (CAD file) to the binary image, and
R was used as a reference and absorbance values these images were used to determine the percentage
showed the difference between the light absorption of R printing accuracy.
and the resin with the different nanofillers. In general, it Comparing both geometries, it was found that in
was observed that in all cases, samples with nanofillers all cases, the accuracy for square-shaped geometry was
had higher absorbance than R, being especially noticeable higher than the circular-shaped geometry. Besides, it
in the case of R+G. These results suggest that G and was noticed that in comparison with pristine resin, GO
GoxNP nanoparticles could be absorbing a significant reduced slightly printing accuracy, whilst this parameter
part of the UV-light that reaches the sample. was not affected by GoxNP.
4.5. Printability 4.6. Dispersibility
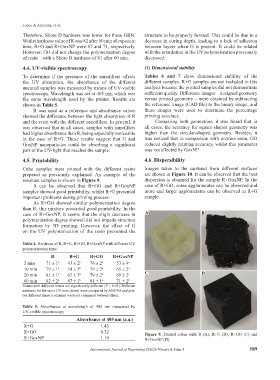
Cube samples were printed with the different resins Images taken to the captured from different surfaces
prepared as previously explained. An example of the are shown in Figure 10. It can be observed that the best
resultant samples is shown in Figure 9. dispersion is obtained for the sample R+GoxNP. In the
It can be observed that R+GO and R+GoxNP case of R+GO, some agglomerates can be observed and
samples showed good printability, whilst R+G presented more and larger agglomerates can be observed in R+G
important problems during printing process. sample.
As R+GO showed similar polymerization degree
than R, this mixture presented good printability. In the
case of R+GoxNP, it seems that the slight decrease in A B
polymerization degree showed did not impede structure
formation by 3D printing. However, the effect of G
on the UV polymerization of the resin prevented the
Table 4. Hardness of R, R+G, R+GO, R+GoxNP with different UV
polymerization time
R R+G R+GO R+GoxNP
5 min 71 ± 1 a 43 ± 2 b 76 ± 2 a 53 ± 4 c
10 min 79 ± 1 a 54 ± 3 b 79 ± 2 a 65 ± 2 c
20 min 81 ± 1 a 63 ± 3 b 79 ± 2 a 69 ± 2 c C D
60 min 82 ± 2 a 67 ± 1 b 81 ± 1 a 71 ± 2 b
Values with different letters are significantly different (P < 0.05). Different
mixtures for the same UV time (rows) were compared by ANOVA analysis,
but different times (columns) were not compared between them.
Table 5. Absorbance at wavelength of 405 nm measured by
UV-visible spectroscopy
Absorbance at 405 nm (a.u.)
R+G 1.43
R+GO 0.32 Figure 9. Printed cubes with R (A), R+G (B), R+GO (C) and
R+GoxNP 1.10 R+GoxNP (D).
International Journal of Bioprinting (2022)–Volume 8, Issue 1 189