
Page 201 - IJB-8-1
P. 201
Lopez de Armentia, et al.
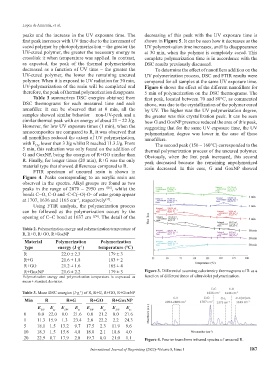
peaks and the increase in the UV exposure time. The decreasing of this peak with the UV exposure time is
first peak increases with UV time due to the increment of shown in Figure 5. It can be seen how it decreases as the
cured polymer by photopolymerization – the greater the UV polymerization time increases, until its disappearance
UV-cured polymer, the greater the necessary energy to at 30 min, when the polymer is completely cured. This
crosslink it when temperature was applied. In contrast, complete polymerization time is in accordance with the
as expected, the peak of the thermal polymerization DSC results previously discussed.
decreased as a function of UV time – the greater the To determine the effect of nanofillers addition on the
UV-cured polymer, the lower the remaining uncured UV polymerization process, DSC and FTIR results were
polymer. When it is exposed to UV radiation for 30 min, compared for all samples at the same UV exposure time.
UV-polymerization of the resin will be completed and Figure 6 shows the effect of the different nanofillers for
therefore, the peak of thermal polymerization disappears. 5 min of polymerization on the DSC thermograms. The
Table 3 summarizes DSC energies obtained from first peak, located between 70 and 80°C, as commented
DSC thermograms for each measured time and each above, was due to the crystallization of the polymer cured
nanofiller. It can be observed that at 0 min, all the by UV. The higher was the UV polymerization degree,
samples showed similar behavior – non-UV-peak and a the greater was this crystallization peak. It can be seen
similar thermal peak with an energy of about 21 – 22 J/g. how G and GoxNP presence reduced the area of this peak,
However, for low UV exposure times (1 min), when the suggesting that for the same UV exposure time, the UV
nanocomposites are compared to R, it was observed that polymerization degree was lower in the case of these
all nanofillers reduced the extent of UV polymerization, nanofillers.
with E lower than 3 J/g whilst R reached 11.3 J/g. From The second peak (150 – 160°C) corresponded to the
UV
5 min, this reduction was only found on the addition of thermal polymerization process of the uncured polymer.
G and GoxNP, being the energies of R+GO similar than Obviously, when the first peak increased, this second
R. Finally, for longer times (20 min), R+G was the only peak decreased because the remaining unpolymerized
material type that showed differences compared to R. resin decreased. In this case, G and GoxNP showed
FTIR spectrum of uncured resin is shown in
Figure 4. Peaks corresponding to an acrylic resin are
observed in the spectra. Alkyl groups are found as two
peaks in the range of 2870 – 2950 cm −1[56] , whilst the
bonds C=O, C-O and -C-C(=O)-O- of ester group appear
at 1707, 1636 and 1165 cm , respectively .
[57]
−1
Using FTIR analysis, the polymerization process
can be followed as the polymerization occurs by the
opening of C=C bond at 1637 cm −1[50] . The detail of the
Table 2. Polymerization energy and polymerization temperature of
R, R+G, R+GO, R+GoxNP
Material Polymerization Polymerization
type energy (J·g ) temperature (°C)
-1
R 22.0 ± 2.3 179 ± 3
R+G 21.6 ± 1.8 183 ± 2
R+GO 21.2 ± 1.6 185 ± 4
R+GoxNP 21.6 ± 2.2 179 ± 3 Figure 3. Differential scanning calorimetry thermograms of R as a
Polymerization energy and polymerization temperature is expressed as function of different times of ultraviolet polymerization.
mean ± standard deviation.
-1
Table 3. Mean DSC energies (J·g ) of R, R+G, R+GO, R+GoxNP
Min R R+G R+GO R+GoxNP
E UV E tc E UV E tc E UV E tc E UV E tc
0 0.0 22.0 0.0 21.6 0.0 21.2 0.0 21.6
1 11.3 15.9 1.3 23.4 2.8 22.2 2.2 24.3
5 18.1 1.5 13.2 9.7 17.5 2.3 11.9 9.6
10 18.3 1.5 15.8 4.8 18.0 2.1 18.6 4.0
20 22.9 0.7 17.9 2.8 19.7 0.0 21.0 1.1 Figure 4. Fourier transform infrared spectra of uncured R.
International Journal of Bioprinting (2022)–Volume 8, Issue 1 187