
Page 107 - IJB-8-3
P. 107
Yang, et al.
A B
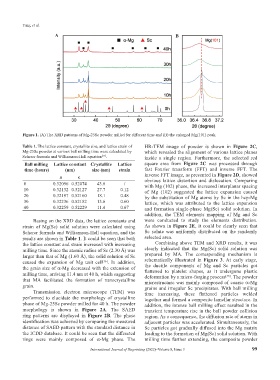
Figure 1. (A) The XRD patterns of Mg-25Sc powder milled for different time and (B) the enlarged Mg(101) peak.
Table 1. The lattice constant, crystallite size, and lattice strain of HR-TEM image of powder is shown in Figure 2C,
Mg-25Sc powder at various ball milling time were calculated by which revealed the alignment of various lattice planes
Scherer formula and Williamson-Hall equation . inside a single region. Furthermore, the selected red
[37]
Ball milling Lattice constant Crystallite Lattice square area from Figure 2C was processed through
time (hours) (nm) size (nm) strain fast Fourier transform (FFT) and inverse FFT. The
a c inverse FFT image, as presented in Figure 2D, showed
0 0.32096 0.52074 43.6 / obvious lattice distortion and dislocation. Comparing
with Mg (102) phase, the increased interplanar spacing
10 0.32132 0.52127 27.7 0.12 of Mg (102) suggested the lattice expansion caused
20 0.32197 0.52160 18.1 0.48 by the substitution of Mg atoms by Sc in the hcp-Mg
30 0.32236 0.52182 13.6 0.60 lattice, which was attributed to the lattice expansion
40 0.32259 0.52229 11.4 0.67 and formation single-phase Mg(Sc) solid solution. In
addition, the TEM elements mapping of Mg and Sc
Basing on the XRD data, the lattice constants and were conducted to study the elements distribution.
strain of Mg(Sc) solid solution were calculated using As shown in Figure 2E, it could be clearly seen that
Scherer formula and Williamson-Hall equation, and the Sc solute was uniformly distributed on the randomly
results are shown in Table 1. It could be seen that both selected area.
the lattice constant and strain increased with increasing Combining above TEM and XRD results, it was
milling time. Since the atomic radius of Sc (2.30 Å) was clearly indicated that the Mg(Sc) solid solution was
larger than that of Mg (1.60 Å), the solid solution of Sc prepared by MA. The corresponding mechanism is
caused the expansion of Mg unit cell . In addition, schematically illustrated in Figure 3. At early stage,
[36]
the grain size of α-Mg decreased with the extension of the ductile components of Mg and Sc particles got
milling time, arriving 11.4 nm at 40 h, which suggesting flattened to platelet shapes, as it undergone plastic
. The powder
deformation by a micro-forging process
[38]
that MA facilitated the formation of nanocrystalline microstructure was mainly composed of coarse α-Mg
grain. grains and irregular Sc precipitates. With ball milling
Transmission electron microscope (TEM) was time increasing, these flattened particles welded
performed to elucidate the morphology of crystalline together and formed a composite lamellar structure. In
phase of Mg-25Sc powder milled for 40 h. The powder addition, the intense ball milling effect resulted in the
morphology is shown in Figure 2A. The SAED transient temperature rise in the ball powder collision
ring patterns are displayed in Figure 2B. The phase region. As a consequence, the diffusion rate of atoms in
identification was achieved by comparing the measured adjacent particles was accelerated. Simultaneously, the
distance of SAED pattern with the standard distance in Sc particles got gradually diffused into the Mg matrix
the ICDD database. It could be seen that the diffracted leading to the formation of Mg(Sc) solid solution. With
rings were mainly composed of α-Mg phase. The milling time further extending, the composite powder
International Journal of Bioprinting (2022)–Volume 8, Issue 3 99