
Page 111 - IJB-8-3
P. 111
Yang, et al.
A
B C
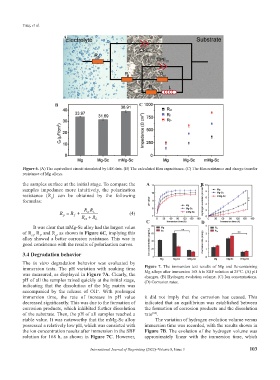
Figure 6. (A) The equivalent circuit simulated by EIS data. (B) The calculated film capacitance. (C) The film resistance and charge transfer
resistance of Mg alloys.
the samples surface at the initial stage. To compare the A B
samples impedance more intuitively, the polarization
resistance (R ) can be obtained by the following
p
formulas:
RR
R = R + ct L (4)
f
p
R + R L
ct
C D
It was clear that mMg-Sc alloy had the largest value
of R , R , and R , as shown in Figure 6C, implying this
p
f
ct
alloy showed a better corrosion resistance. This was in
good consistence with the results of polarization curves.
3.4 Degradation behavior
The in vitro degradation behavior was evaluated by
immersion tests. The pH variation with soaking time Figure 7. The immersion test results of Mg and Sc-containing
Mg alloys after immersion 168 h in SBF solution at 25°C. (A) pH
was measured, as displayed in Figure 7A. Clearly, the changes. (B) Hydrogen evolution volume. (C) Ion concentrations.
pH of all the samples raised quickly at the initial stage, (D) Corrosion rates.
indicating that the dissolution of the Mg matrix was
accompanied by the release of OH . With prolonged
−
immersion time, the rate of increase in pH value it did not imply that the corrosion has ceased. This
decreased significantly. This was due to the formation of indicated that an equilibrium was established between
corrosion products, which inhibited further dissolution the formation of corrosion products and the dissolution
of the substrate. Then, the pH of all samples reached a rate [56] .
stable value. It was noteworthy that the mMg-Sc alloy The variation of hydrogen evolution volume versus
possessed a relatively low pH, which was consisted with immersion time was recorded, with the results shown in
the ion concentration results after immersion in the SBF Figure 7B. The evolution of the hydrogen volume was
solution for 168 h, as shown in Figure 7C. However, approximately linear with the immersion time, which
International Journal of Bioprinting (2022)–Volume 8, Issue 3 103