
Page 108 - IJB-8-3
P. 108
Rare Earth Magnesium Alloy
A B E
E1
C D
E2
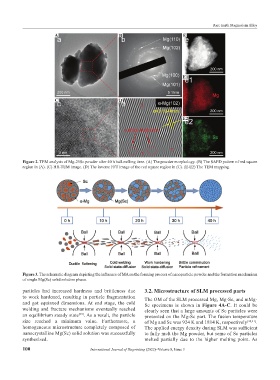
Figure 2. TEM analysis of Mg-25Sc powder after 40 h ball-milling time. (A) The powder morphology. (B) The SAED pattern of red square
region in (A). (C) HR-TEM image. (D) The inverse FFT image of the red square region in (C). (E-E2) The TEM mapping.
Figure 3. The schematic diagram depicting the influence of MA on the forming process of nanoparticle powder and the formation mechanism
of single Mg(Sc) solid solution phase.
particles had increased hardness and brittleness due 3.2. Microstructure of SLM processed parts
to work hardened, resulting in particle fragmentation The OM of the SLM processed Mg, Mg-Sc, and mMg-
and got equiaxed dimensions. At end stage, the cold Sc specimens is shown in Figure 4A-C. It could be
welding and fracture mechanisms eventually reached clearly seen that a large amounts of Sc particles were
an equilibrium steady state [39] . As a result, the particle presented on the Mg-Sc part. The fusion temperature
size reached a minimum value. Furthermore, a of Mg and Sc was 924 K and 1814 K, respectively [40,41] .
homogeneous microstructure completely composed of The applied energy density during SLM was sufficient
nanocrystalline Mg(Sc) solid solution was successfully to fully melt the Mg powder, but some of Sc particles
synthesized. melted partially due to the higher melting point. As
100 International Journal of Bioprinting (2022)–Volume 8, Issue 3