
Page 112 - IJB-8-3
P. 112
Rare Earth Magnesium Alloy
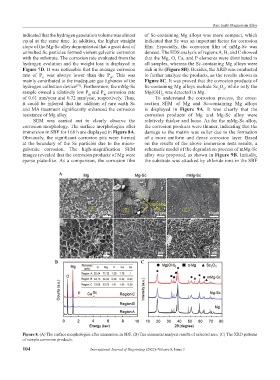
indicated that the hydrogen generation volume was almost of Sc-containing Mg alloys was more compact, which
equal at the same time. In addition, the higher straight indicated that Sc was an important factor for corrosion
slope of the Mg-Sc alloy demonstrated that a great deal of film. Especially, the corrosion film of mMg-Sc was
unmelted Sc particles formed violent galvanic corrosion densest. The EDS analysis of regions A, B, and C showed
with the substrate. The corrosion rate evaluated from the that the Mg, O, Ca, and P elements were distributed in
hydrogen evolution and the weight loss is displayed in all samples, whereas the Sc-containing Mg alloys were
Figure 7D. It was noticeable that the average corrosion rich in Sc (Figure 8B). Besides, the XRD was conducted
rate of P was always lower than the P . This was to further analyze the products, as the results shown in
H
W
mainly contributed to the inadequate gas tightness of the Figure 8C. It was proved that the corrosion products of
hydrogen collection device . Furthermore, the mMg-Sc Sc-containing Mg alloys include Sc O , while only the
[57]
3
2
sample owned a relatively low P and P corrosion rate Mg(OH) was detected in Mg.
2
H
W
of 0.61 mm/year and 0.72 mm/year, respectively. Thus, To understand the corrosion process, the cross-
it could be inferred that the addition of rare earth Sc section SEM of Mg and Sc-containing Mg alloys
and MA treatment significantly enhanced the corrosion is displayed in Figure 9A. It was clearly that the
resistance of Mg alloy. corrosion products of Mg and Mg-Sc alloy were
SEM was carried out to clearly observe the relatively thicker and loose. As for the mMg-Sc alloy,
corrosion morphology. The surface morphologies after the corrosion products were thinner, indicating that the
immersion in SBF for 168 h are displayed in Figure 8A. damage to the matrix was softer due to the formation
Obviously, the significant corrosion pits were formed of a more uniform and dense corrosion layer. Based
at the boundary of the Sc particles due to the micro- on the results of the above immersion tests results, a
galvanic corrosion. The high-magnification SEM schematic model of the degradation process of mMg-Sc
images revealed that the corrosion products of Mg were alloy was proposed, as shown in Figure 9B. Initially,
sparse plate-like. As a comparison, the corrosion film the substrate was attacked by chloride ions in the SBF
A
B C
Figure 8. (A) The surface morphologies after immersion in SBF. (B) The elemental analysis results of selected area. (C) The XRD patterns
of sample corrosion products.
104 International Journal of Bioprinting (2022)–Volume 8, Issue 3