
Page 217 - IJB-8-3
P. 217
Villapún, et al.
A B C
D E F
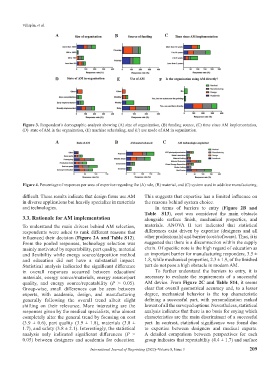
Figure 3. Respondent’s demographic analysis showing (A) size of organization, (B) funding source, (C) time since AM implementation,
(D) state of AM in the organization, (E) machine scheduling, and (F) use mode of AM in organization.
A B C
Figure 4. Percentage of responses per area of expertise regarding the (A) role, (B) material, and (C) system used in additive manufacturing.
difficult. These results indicate that design firms use AM This suggests that expertise has a limited influence on
in diverse applications but heavily specialize in materials the reasons behind system choice.
and technologies. In terms of barriers to entry (Figure 2B and
Table S13), cost was considered the main obstacle
3.3. Rationale for AM implementation alongside surface finish, mechanical properties, and
To understand the main drivers behind AM selection, materials. ANOVA II test indicated that statistical
respondents were asked to rank different reasons that differences exist driven by expertise (designers and all
influenced their decision (Figure 2A and Table S12). other professionals) and barrier (cost/software). Thus, it is
From the pooled responses, technology selection was suggested that there is a disconnection within the supply
mainly motivated by repeatability, part quality, material chain. Of specific note is the high regard of education as
and flexibility while energy source/deposition method an important barrier for manufacturing responders, 3.5 ±
and education did not have a substantial impact. 1.8, while mechanical properties, 2.3 ± 1.9, of the finished
Statistical analysis indicated the significant difference part do not pose a high obstacle in modern AM.
in overall responses occurred between education/ To further understand the barriers to entry, it is
materials, energy source/materials, energy source/part necessary to evaluate the requirements of a successful
quality, and energy source/repeatability (P > 0.05). AM device. From Figure 2C and Table S14, it seems
Group-wise, small differences can be seen between clear that overall geometrical accuracy and, to a lesser
experts, with academia, design, and manufacturing degree, mechanical behavior is the top characteristic
generally following the overall trend albeit slight defining a successful part, with personalization ranked
shifting on their relevance. More interesting are the lowest of all the surveyed options. Nevertheless, statistical
responses given by the medical specialists, who almost analysis indicates that there is no basis for saying which
completely alter the general trend by focusing on cost characteristics are the main discriminant of a successful
(3.9 ± 0.6), part quality (3.9 ± 1.8), materials (3.8 ± part. In contrast, statistical significance was found due
1.7), and safety (3.8 ± 2.1). Interestingly, the statistical to expertise between designers and medical experts.
analysis only indicated significant differences (P > A detailed comparison between perspectives for each
0.05) between designers and academia for education. group indicates that repeatability (4.4 ± 1.7) and surface
International Journal of Bioprinting (2022)–Volume 8, Issue 3 209