
Page 12 - IJB-9-1
P. 12
International Journal of Bioprinting Biocompatible materials and Multi Jet Fusion
2.7. 3D bioprinting Table 2. Primer sequences used for gene expression analysis
The 3D bioprinting proceeded with the same parameters Gene name Forward/ Sequence
as those in the printing accuracy analysis; the only Reverse
difference was the printing nozzle, which was 25 G. After
bioprinting, the constructs were crosslinked with sterile COL1A1 F 5’-ACGTCCTGGTGAAGTTGGTC-3’
200 mM calcium chloride (CaCl ) (Sigma-Aldrich) R 5’-ACGTCCTGGTGAAGTTGGTC-3’
2
dissolved in 4.6% (w/v) D-mannitol for 10 minutes at COL2A1 F 5’-CTGGAAAAGATGGTCCCAAAG-3’
room temperature. Then, the constructs were cultured in R 5’-CAGGGAATCCTCTCTCACCAC-3’
supplemented CGM™ Chondrocyte Growth Medium with COL10A1 F 5’-TTACGCTGAACGATACCAAATG-3’
5 mM CaCl in standard conditions. R 5’-GACTTCCGTAGCCTGGTTTTC-3’
2
2.8. Live/dead assay SOX9 F 5’-GACTCGCCACACTCCTCCT-3’
After 24 h, 7 days, 14 days, and 28 days, three bioprinted R 5’-AGGTCTCGATGTTGGAGATGAC-3’
constructs were divided for viability and gene expression RUNX2 F 5’-ACCAGATGGGACTGTGGTTACT-3’
analyses. The live/dead assay was performed according to R 5’-TGTGAAGACGGTTATGGTCAAG-3’
the product manual (LIVE/DEAD® Viability/Cytotoxicity
Kit, Invitrogen), with the utilization of confocal microscopy GAPDH F 5’-TGACATCAAGAAGGTGGTGAAG-3’
(IX83, Olympus). Scans for viability assessment were R 5’-TTCGTTGTCATACCAGGAAATG-3’
taken from the approximate midpoint of three different
constructs at each time point. From each of these scans, two designed starters are shown in Table 2. The QuantStudio
middle slices were selected for live and dead cell counting. 6k Flex Real-Time PCR System (Applied Biosystems) with
These images were analyzed with the ImageJ software.
1 μL of complementary deoxyribonucleic acid (cDNA) and
2.9. Gene expression analysis Maxima SYBR Green/ROX qPCR Master Mix (Thermo
Three constructs from each time point were dissolved in Scientific) was used to evaluate the expression of these
100 mM sodium citrate, containing 0.08 U·μL Proteinase genes. Primers were used at a final concentration of 0.5
−1
K and 1.0 U·μL RNAse Inhibitor (A&A Biotechnology), μM. The gene expression results were tested with the two-
−1
while shaking for 5 minutes at 37°C, followed by way analysis of variance (ANOVA).
ribonucleic acid (RNA) isolation with TriReagent (Sigma- 2.10. Data analysis
Aldrich). Chloroform was then added, and the probes GraphPad Prism 8.0.1 was used for statistical computing
were centrifuged at 12,000 RCF for 15 minutes at 4°C. The and graph preparation.
supernatant was collected and mixed with a 1:1 volume of
cold 99% ethanol. The solution was then transferred to the 3. Results
columns from RNeasy Mini Kit. The isolation steps were
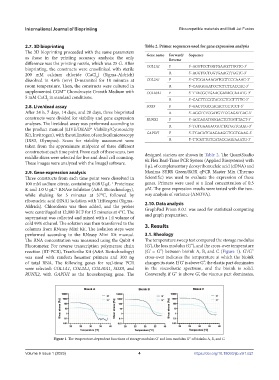
performed according to the RNeasy Mini Kit manual. 3.1. Rheology
The RNA concentration was measured using the Qubit 4 The temperature sweep test compared the storage modulus
Fluorometer. For reverse transcription polymerase chain (G’), the loss modulus (G’’), and the cross-over temperature
reaction (RT-PCR), TranScriba Kit (A&A Biotechnology) (G’ = G’’) between bioink A, B, and C (Figure 1). G’/G’’
was used with random hexamer primers and 300 ng cross-over indicates the temperature at which the bioink
of total RNA. The following genes for real-time PCR changes its state. If G’ is above G’’, the elastic part dominates
were selected: COL1A1, COL2A1, COL10A1, SOX9, and in the viscoelastic spectrum, and the bioink is solid.
RUNX2, with GAPDH as the housekeeping gene. The Conversely, if G’’ is above G’, the viscous part dominates,
Figure 1. The temperature-dependent functions of storage modulus G’ and loss modulus G’’ of bioinks A, B, and C.
Volume 9 Issue 1 (2023) 4 https://doi.org/10.18063/ijb.v9i1.621