
Page 161 - IJB-9-1
P. 161
International Journal of Bioprinting Bio-inks for 3D printing cell microenvironment
simulating these microenvironment cues. Although many The mixing of multiple bio-ink components allows
researchers have claimed that their models and materials for partially anisotropic microenvironments. In order to
are accurate replicas of a certain microenvironment, no in exhibit different stiffness distributions in the same space,
vitro model has yet to match the mechanical cues of living it is necessary to create a gradient stiffness structure.
tissues. Native tissues have microstructures that give them The gradient of stiffness can be regulated by either a
distinct mechanical properties in different directions; for concentration gradient or a cross-linking degree gradient.
instance, myocardium-specific microstructure endows the Coaxial bioprinting or multi-jet bioprinting is useful
heart with anisotropic modulus, thus conferring the heart for gradient structures , and by adjusting the bio-ink
[75]
with significant directional properties during contraction . input or curing parameters, a layer-by-layer gradient
[74]
Reproducing this anisotropy in vitro has become a challenge environment can also be achieved via lithography. For
for cardiac regenerative medicine. Achieving this anisotropy example, soft hydrogels are mixed with stiff hydrogels in
through non-uniform bio-ink arrangement is one of the dynamic ratios during bioprinting by a static mixer device,
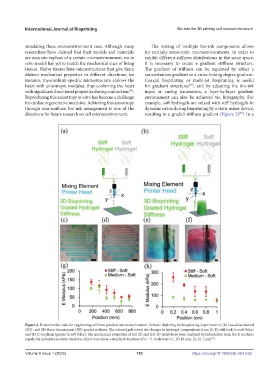
directions for future research on cell microenvironment. resulting in a graded stiffness gradient (Figure 2) . In a
[75]
Figure 2. Extrusion bio-inks for engineering stiffness gradient microenvironment. Scheme depicting the bioprinting experiment of (A) two-dimensional
(2D)- and (B) three-dimensional (3D)-graded stiffness. The colored gels reveal the changes in hydrogel compositions from (C, E) stiff (red) to soft (blue)
and (D, F) medium (green) to soft (blue). The mechanical properties of (G) 2D and (H) 3D prints have been analyzed by indentation tests; the E modulus
equals the indentation elastic modulus. Error bars show a standard deviation of n = 3. Scale bars: (C, D) 10 mm, (E, F) 1 mm .
[75]
Volume 9 Issue 1 (2023) 153 https://doi.org/10.18063/ijb.v9i1.632