
Page 312 - IJB-9-1
P. 312
International Journal of Bioprinting Error assessment and correction
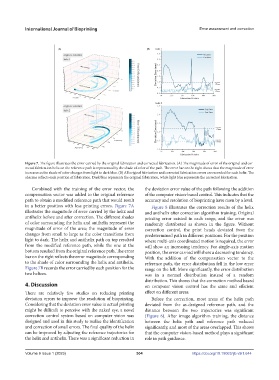
Figure 7. The figure illustrates the error carried by the original fabrication and corrected fabrication. (A) The magnitude of error of the original and cor-
rected fabrication helix on the reference path is represented by the shade of color of the path. The error bar on the right shows that the magnitude of error
increases as the shade of color changes from light to dark blue. (B) All original fabrication and corrected fabrication errors are recorded for each helix. The
abscissa reflects each position of fabrication. Dark blue represents the original fabrication, while light blue represents the corrected fabrication.
Combined with the training of the error vector, the the deviation error value of the path following the addition
compensation vector was added to the original reference of the computer vision-based control. This indicates that the
path to obtain a modified reference path that would result accuracy and resolution of bioprinting have risen by a level.
in a better position with less printing errors. Figure 7A Figure 8 illustrates the correction results of the helix
illustrates the magnitude of error carried by the helix and and antihelix after correction algorithm training. Original
antihelix before and after correction. The different shades printing error existed in each range, and the error was
of color surrounding the helix and antihelix represent the randomly distributed as shown in the figure. Without
magnitude of error of the area; the magnitude of error correction control, the print heads deviated from the
changes from small to large as the color transitions from predetermined path in different positions. For the position
light to dark. The helix and antihelix path on top resulted where multi-axis coordinated motion is required, the error
from the modified reference path, while the one at the will show an increasing tendency. For single-axis motion
bottom resulted from the original reference path. The error position, the error carried will show a decreasing tendency.
bar on the right reflects the error magnitude corresponding With the addition of the compensation vector to the
to the shade of color surrounding the helix and antihelix. reference path, the error distribution fell in the low error
Figure 7B records the error carried by each position for the range on the left. More significantly, the error distribution
two helices. was in a normal distribution instead of a random
distribution. This shows that the correction method based
4. Discussion on computer vision control has the same and efficient
There are relatively few studies on reducing printing effect on different areas.
deviation errors to improve the resolution of bioprinting. Before the correction, most areas of the helix path
Considering that the deviation error value in actual printing deviated from the as-designed reference path, and the
might be difficult to perceive with the naked eye, a novel distance between the two trajectories was significant
correction control system based on computer vision was (Figure 6). After image algorithm training, the distance
designed and used in this study to realize the identification between the helix path and reference path reduced
and correction of small errors. The final quality of the helix significantly, and most of the areas overlapped. This shows
can be improved by adjusting the reference trajectories for that the computer vision-based method plays a significant
the helix and antihelix. There was a significant reduction in role in path guidance.
Volume 9 Issue 1 (2023)olume 9 Issue 1 (2023) 304 https://doi.org/10.18063/ijb.v9i1.644
V