
Page 321 - IJB-9-1
P. 321
International Journal of Bioprinting Sterilization effect on 3D printed inks
Table 1. The parameters of Cross model for GEL-SA samples as a function of the sterilization method (CONTROL, UV, FILT, and
AUTO) and media (DMEM, PBS, and water) used.
Sample η 0 η ∞ C m R 2
(Pa·s) (Pa·s) (s)
DMEM-CONTROL 446.79 0.00 0.617 1.244 0.99
DMEM-UV 255.72 0.37 0.619 1.277 0.99
DMEM-FILT 3.70 0.60 0.153 1.611 0.99
DMEM-AUTO 0.42 0.16 0.555 0.617 1.00
PBS-CONTROL 412.19 0.00 0.321 1.468 0.99
PBS-UV 268.80 0.45 0.430 1.299 0.99
PBS-FILT 1.81 0.32 0.178 1.186 1.00
PBS-AUTO 0.18 0.13 0.197 1.639 1.00
Water-CONTROL 629.57 0.00 0.377 1.406 0.99
Water-UV 295.98 0.64 0.297 1.475 0.99
Water-FILT 0.17 0.10 0.075 0.773 1.00
Water-AUTO 0.10 0.07 0.104 0.471 1.00
CONTROL: non-sterilized inks; UV: UV-sterilized inks; FILT: filtered inks; AUTO: autoclaved inks
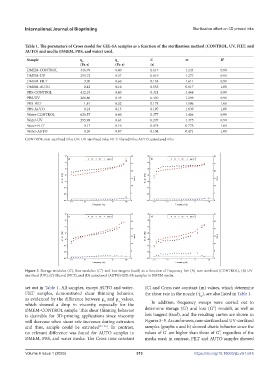
Figure 3. Storage modulus (G'), loss modulus (G") and loss tangent (tanδ) as a function of frequency for: (A) non-sterilized (CONTROL), (B) UV-
sterilized (UV), (C) filtered (FILT), and (D) autoclaved (AUTO) GEL-SA samples in DMEM media.
set out in Table 1. All samples, except AUTO and water- (C) and Cross rate constant (m) values, which determine
⋅
FILT samples, demonstrated shear thinning behavior, the shear rate in the nozzle ( γ ), are also listed in Table 1.
w
as evidenced by the difference between µ and µ values,
0
∞
which showed a drop in viscosity, especially for the In addition, frequency sweeps were carried out to
DMEM-CONTROL sample. This shear thinning behavior determine storage (G’) and loss (G”) moduli, as well as
is desirable for 3D-printing applications since viscosity loss tangent (tanδ), and the resulting curves are shown in
will decrease when shear rate increases during extrusion Figures 3–5. As can be seen, non-sterilized and UV-sterilized
and thus, sample could be extruded [44–46] . In contrast, samples (graphs a and b) showed elastic behavior since the
no relevant difference was found for AUTO samples in values of G’ are higher than those of G”, regardless of the
DMEM, PBS, and water media. The Cross time constant media used; in contrast, FILT and AUTO samples showed
Volume 9 Issue 1 (2023) 313 https://doi.org/10.18063/ijb.v9i1.645