
Page 323 - IJB-9-1
P. 323
International Journal of Bioprinting Sterilization effect on 3D printed inks
3.2. 3D printing of the constructs obtained with AUTO and FILT samples
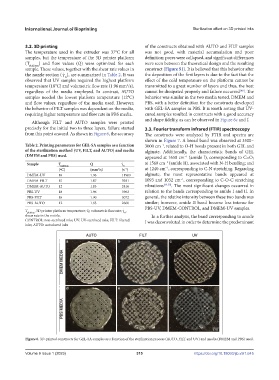
The temperature used in the extruder was 37°C for all was not good, with material accumulation and poor
samples, but the temperature of the 3D printer platform definition; pores were collapsed, and significant differences
(T platform ) and flow values (Q) were optimized for each were seen between the theoretical design and the resulting
sample. These values, together with the shear rate values in construct (Figure S1). It is believed that this behavior after
⋅
the nozzle section ( γ ), are summarized in Table 2. It was the deposition of the first layers is due to the fact that the
w
observed that UV samples required the highest platform effect of the cold temperature on the platform cannot be
temperature (18°C) and volumetric flow rate (1.96 mm /s), transmitted to a great number of layers and thus, the heat
3
regardless of the media employed. In contrast, AUTO cannot be dissipated properly and failure occurred . The
[48]
samples needed the lowest platform temperature (12°C) behavior was similar in the two media tested, DMEM and
and flow values, regardless of the media used. However, PBS, with a better definition for the constructs developed
the behavior of FILT samples was dependent on the media, with GEL-SA samples in PBS. It is worth noting that UV-
requiring higher temperature and flow rate in PBS media. cured samples resulted in constructs with a good accuracy
and shape fidelity, as can be observed in Figure 6c and f.
Although FILT and AUTO samples were printed
precisely for the initial two to three layers, failure started 3.3. Fourier transform infrared (FTIR) spectroscopy
from this point onward. As shown in Figure 6, the accuracy The constructs were analyzed by FTIR and spectra are
shown in Figure 7. A broad band was observed at 3500–
Table 2. Printing parameters for GEL-SA samples as a function 3000 cm , related to O-H bonds present in both GEL and
−1
of the sterilization method (UV, FILT, and AUTO) and media alginate. Additionally, the characteristic bands of GEL
(DMEM and PBS) used. appeared at 1650 cm (amide I), corresponding to C=O;
−1
−1
Sample T Q γ ⋅ at 1560 cm (amide II), associated with N-H bending; and
platform w
−1
(ºC) (mm /s) (s ) at 1240 cm , corresponding to C-N stretching. Regarding
3
−1
DMEM-UV 18 1.96 11909 alginate, the most representative bands appeared at
−1
DMEM-FILT 15 1.87 3931 1093 and 1032 cm , corresponding to C-O-C stretching
DMEM-AUTO 12 1.83 2416 vibrations [49,50] . The most significant changes occurred in
PBS-UV 18 1.96 3962 relation to the bands corresponding to amide I and II. In
PBS-FILT 18 1.90 5072 general, the relative intensity between these two bands was
PBS-AUTO 12 1.83 2660 similar; however, amide II band became less intense for
⋅
T platform ,3D printer platform temperature; Q, volumetric flow rate; γ , PBS-UV, DMEM-CONTROL, and DMEM-UV samples.
w
shear rate in the nozzle. In a further analysis, the band corresponding to amide
CONTROL: non-sterilized inks; UV: UV-sterilized inks; FILT: filtered I was deconvoluted in order to determine the predominant
inks; AUTO: autoclaved inks
Figure 6. 3D-printed constructs for GEL-SA samples as a function of the sterilization process (AUTO, FILT and UV) and media (DMEM and PBS) used.
Volume 9 Issue 1 (2023) 315 https://doi.org/10.18063/ijb.v9i1.645