
Page 320 - IJB-9-1
P. 320
International Journal of Bioprinting Sterilization effect on 3D printed inks
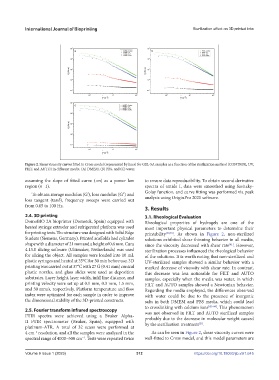
Figure 2. Shear viscosity curves fitted to Cross model (represented by lines) for GEL-SA samples as a function of the sterilization method (CONTROL, UV,
FILT, and AUTO) in different media: (A) DMEM, (B) PBS, and (C) water.
assuming the slope of fitted curve (-m) as a power law to ensure data reproducibility. To obtain second derivative
region (n−1). spectra of amide I, data were smoothed using Savitzky-
Golay function, and curve fitting was performed via peak
To obtain storage modulus (G'), loss modulus (G") and
loss tangent (tanδ), frequency sweeps were carried out analysis using OriginPro 2021 software.
from 0.05 to 100 Hz.
3. Results
2.4. 3D printing 3.1. Rheological Evaluation
DomoBIO 2A bioprinter (Domotek, Spain) equipped with Rheological properties of hydrogels are one of the
heated syringe extruder and refrigerated platform was used most important physical parameters to determine their
for printing tests. The structure was designed with Solid Edge printability [30,40] . As shown in Figure 2, non-sterilized
Student (Siemens, Germany). Printed scaffolds had cylinder solutions exhibited shear thinning behavior in all media,
shape with a diameter of 21 mm and a height of 0.6 mm. Cura since the viscosity decreased with shear rate . However,
[41]
4.13.0 slicing software (Ultimaker, Netherlands) was used sterilization processes influenced the rheological behavior
for slicing the object. All samples were loaded into 10 mL of the solutions. It is worth noting that non-sterilized and
plastic syringes and heated at 35°C for 30 min before use. 3D UV-sterilized samples showed a similar behavior with a
printing was carried out at 37°C with 27 G (0.41 mm) conical marked decrease of viscosity with shear rate. In contrast,
plastic nozzles, and glass slides were used as deposition this decrease was less noticeable for FILT and AUTO
substrates. Layer height, layer width, infill line distance, and samples, especially when the media was water, in which
printing velocity were set up at 0.1 mm, 0.3 mm, 1.5 mm, FILT and AUTO samples showed a Newtonian behavior.
and 30 mm/s, respectively. Platform temperature and flow Regarding the media employed, the differences observed
index were optimized for each sample in order to improve with water could be due to the presence of inorganic
the dimensional stability of the 3D-printed constructs. salts in both DMEM and PBS media, which could lead
to crosslinking with calcium ions [42–44] . This phenomenon
2.5. Fourier transform infrared spectroscopy was not observed in FILT and AUTO sterilized samples
FTIR spectra were achieved using a Bruker Alpha- probably due to the decrease in molecular weight caused
II FTIR spectrometer (Bruker, Spain), equipped with by the sterilization treatment .
[21]
platinum-ATR. A total of 32 scans were performed at
4 cm resolution, and all the samples were analyzed in the As can be seen in Figure 2, shear viscosity curves were
−1
−1
spectral range of 4000–500 cm . Tests were repeated twice well-fitted to Cross model, and this model parameters are
Volume 9 Issue 1 (2023) 312 https://doi.org/10.18063/ijb.v9i1.645