
Page 103 - IJB-9-2
P. 103
International Journal of Bioprinting Holistic charge-based MEW scaffold model
A B C
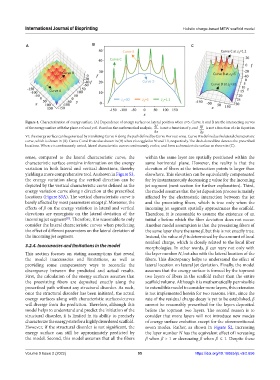
Figure 4. Characterization of energy surface. (A) Dependence of energy surface on lateral position when z=5. Curve A and B are the intersecting curves
of the energy surface with the plane x=0 and y=0. Based on the mathematical analysis, ∂f is not a function of y, and ∂f is not a function of x in Equation
∂x ∂y
VI; the energy surface can be generated by translating Curve A along the path defined by Curve B or vice versa. Curve B is defined as the lateral characteristic
curve, which is shown in (B). Curve C and D are also shown in (B) when z is toggled at 30 and 1.1, respectively. The dash-dotted line denotes the prescribed
locations. When z is continuously varied, lateral characteristic curves continuously evolve, and form a characteristic surface as shown in (C).
sense, compared to the lateral characteristic curve, the within the same layer are spatially positioned within the
characteristic surface contains information on the energy same horizontal plane. However, the reality is that the
variation in both lateral and vertical directions, thereby elevation of fibers at the intersection points is larger than
yielding a more comprehensive tool. As shown in Figure S3, elsewhere. This elevation can be equivalently compensated
the energy variation along the vertical direction can be for by instantaneously decreasing z value for the incoming
depicted by the vertical characteristic curve defined as the jet segment (next section for further explanation). Third,
energy variation curve along z direction at the prescribed the model assumes that the jet deposition process is mainly
locations (Figure S3A). The vertical characteristic curve is affected by the electrostatic interaction between the jet
barely affected by most parameters except β. Moreover, the and the preexisting fibers, which is true only when the
effects of β on the energy variation in lateral and vertical incoming jet segment spatially approximates the scaffold.
directions are synergistic on the lateral deviation of the Therefore, it is reasonable to assume the existence of an
incoming jet segment . Therefore, it is reasonable to only initial z before which the fiber deviation does not occur.
[33]
consider the lateral characteristic curves when predicting Another model assumption is that the preexisting fibers of
the effect of different parameters on the lateral deviation of the same layer share the same β, but this is not exactly true.
the incoming jet segment. Instead, the value of β is determined by the amount of local
residual charge, which is closely related to the local fiber
3.2.4. Inaccuracies and limitations in the model morphologies. In other words, β can vary not only with
This section focuses on stating assumptions that reveal the layer number N, but also with the lateral location of the
the model inaccuracies and limitations, as well as fibers. This discrepancy helps to understand the effect of
providing some compensatory ways to reconcile the lateral location on lateral jet deviation. Finally, the model
discrepancy between the predicted and actual results. assumes that the energy surface is formed by the topmost
First, the calculation of the energy surfaces assumes that two layers of fibers in the scaffold rather than the entire
the preexisting fibers are deposited exactly along the scaffold volume. Although it is mathematically permissible
prescribed path without any structural disorder. As such, to extend this model to consider more layers, this extension
once the structural disorder has been initiated, the actual is not implemented herein for two reasons. First, since the
energy surfaces along with characteristic surfaces/curves rate of the residual charge decay is yet to be established, β
will diverge from the prediction. Therefore, although this cannot be reasonably prescribed for the layers deposited
model helps to understand and predict the initiation of the before the topmost two layers. The second reason is to
structural disorder, it is limited in its ability to precisely consider that more layers will not introduce new modes
characterize the energy state for a highly disordered scaffold. of energy surface evolution except for the aforementioned
However, if the structural disorder is not significant, the seven modes. Rather, as shown in Figure S2, increasing
energy surface can still be approximately predicted by the layer number N has the equivalent effect of increasing
the model. Second, this model assumes that all the fibers β when β > 1 or decreasing β when β ≤ 1. Despite these
Volume 9 Issue 2 (2022) 95 https://doi.org/10.18063/ijb.v9i2.656