
Page 131 - IJB-9-2
P. 131
International Journal of Bioprinting Design and manufacture of high-performance bone plate
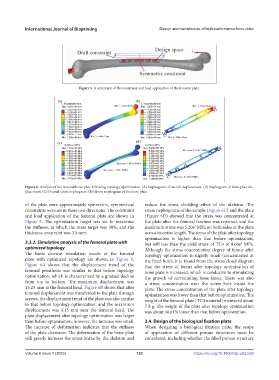
Figure 5. A schematic of the constraint and load application of the femoral plate.
Figure 6. Analysis of the femoral bone plate following topology optimization. (A) Nephogram of overall displacement. (B) Nephogram of bone plate dis-
placement. (C) Overall stress nephogram. (D) Stress nephogram of the bone plate.
of the plate were approximately symmetric, symmetrical reduce the stress shielding effect of the skeleton. The
constraints were set in these two directions. The constraint stress nephograms of the sample (Figure 6C) and the plate
and load application of the femoral plate are shown in (Figure 6D) showed that the stress was concentrated at
Figure 5. The optimization target was set to maximize the plate after the femoral fracture was repaired, and the
the stiffness, in which the mass target was 30%, and the maximum stress was 5.20e MPa on both sides of the plate
2
thickness constraint was 3.5 mm. across its entire length. The stress of the plate after topology
optimization is higher than that before optimization,
3.3.2. Simulation analysis of the femoral plate with but still less than the yield stress of TC4 of 8.60e MPa.
2
optimized topology Although the stress concentration degree of femur after
The finite element simulation results of the femoral topology optimization is slightly small (concentrated at
plate with optimized topology are shown in Figure 6. the fixed hole), it is found from the stress cloud diagram
Figure 6A shows that the displacement trend of the that the stress of femur after topology optimization of
femoral prosthesis was similar to that before topology bone plate is increased, which is conducive to stimulating
optimization, which is characterized by a gradual decline the growth of surrounding bone tissue. There was also
from top to bottom. The maximum displacement was a stress concentration near the screw hole inside the
13.23 mm at the femoral head. Figure 6B shows that after plate. The stress concentration of the plate after topology
femoral displacement was transferred to the plate through optimization was lower than that before optimization. The
screws, the displacement trend of the plate was also similar weight of the femoral plate (TC4 material) measured about
to that before topology optimization, and the maximum 7.8 g. The weight of the plate after topology optimization
displacement was 4.13 mm near the femoral head. The was about 48.81% lower than that before optimization.
plate displacement after topology optimization was larger
than before optimization; however, the increase was small. 3.4. Design of the biological fixation plate
The increase of deformation indicates that the stiffness When designing a biological fixation plate, the scope
of the plate decreases. The deformation of the bone plate of application of different porous structures must be
will greatly increase the stress borne by the skeleton and considered, including whether the filled porous structure
Volume 9 Issue 2 (2023) 123 https://doi.org/10.18063/ijb.v9i2.658