
Page 367 - IJB-9-2
P. 367
International Journal of Bioprinting Laser bioprinting of hiPSC-derived neural stem cells and neurons
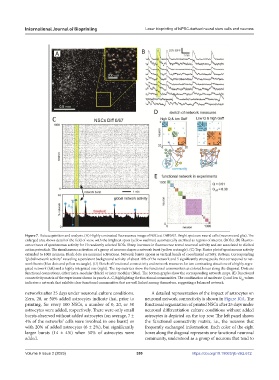
Figure 7. Data acquisition and analysis. (A) Highly contrasted fluorescence image of NSCs at Diff 0/67. Bright spots are neural cells (neurons and glia). The
enlarged area shows detail of the field of view, with the brightest spots (yellow outlines) automatically ascribed as regions of interest (ROIs). (B) Fluores-
cence traces of spontaneous activity for 10 randomly selected ROIs. Sharp increases in fluorescence reveal neuronal activity and are associated to elicited
action potentials. The simultaneous activation of a group of neurons shapes a network burst (yellow rectangle). (C) Top: Raster plot of spontaneous activity
extended to 1000 neurons. Black dots are neuronal activations. Network bursts appear as vertical bands of coordinated activity. Bottom: Corresponding
“global network activity” revealing a persistent background activity of about 10% of the network and 5 significantly strong peaks that correspond to net-
work bursts (blue dots and yellow rectangle). (D) Sketch of functional connectivity and network measures for two contrasting situations of a highly segre-
gated network (left) and a highly integrated one (right). The top matrices show the functional communities as colored boxes along the diagonal. Dots are
functional connections, either intra-modular (black) or inter-modular (blue). The bottom graphs show the corresponding network maps. (E) Functional
connectivity matrix of the experiment shown in panels A–C, highlighting the functional communities. The combination of moderate Q and low G values
eff
indicates a network that exhibits clear functional communities that are well linked among themselves, suggesting a balanced network.
networks after 25 days under neuronal culture conditions. A detailed representation of the impact of astrocytes on
Zero, 20, or 50% added astrocytes indicate that, prior to neuronal network connectivity is shown in Figure 10A. The
printing, for every 100 NSCs, a number of 0, 20, or 50 functional organization of printed NSCs after 25 days under
astrocytes were added, respectively. There were only small neuronal differentiation culture conditions without added
bursts observed without added astrocytes (on average, 7 ± astrocytes is depicted on the top row. The left panel shows
4% of the networks’ cells were involved in one burst) or the functional connectivity matrix, i.e., the neurons that
with 20% of added astrocytes (6 ± 2%), but significantly frequently exchanged information. Each color of the eight
larger bursts (14 ± 4%) when 50% of astrocytes were boxes along the diagonal represents one functional neuronal
added. community, understood as a group of neurons that tend to
Volume 9 Issue 2 (2023) 359 https://doi.org/10.18063/ijb.v9i2.672