
Page 368 - IJB-9-2
P. 368
International Journal of Bioprinting Laser bioprinting of hiPSC-derived neural stem cells and neurons
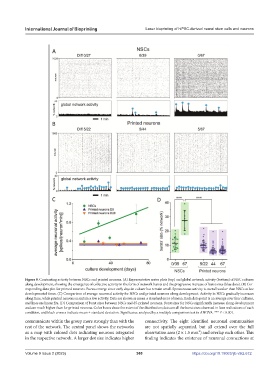
Figure 8. Contrasting activity between NSCs and printed neurons. (A) Representative raster plots (top) and global network activity (bottom) of NSC cultures
along development, showing the emergence of collective activity in the form of network bursts and the progressive increase of burst sizes (blue dots). (B) Cor-
responding data plot for printed neurons. Bursts emerge since early days in culture but remain small. Spontaneous activity is overall weaker than NSCs at late
developmental times. (C) Comparison of average neuronal activity for NSCs and printed neurons along development. Activity in NSCs gradually increases
along time, while printed neurons maintain a low activity. Data are shown as mean ± standard error of mean. Each data point is an average over four cultures,
and lines are linear fits. (D) Comparison of burst sizes between NSCs and d5-printed neurons. Burst sizes for NSCs significantly increase along development
and are much higher than for printed neurons. Color boxes show the extent of the distribution; dots are all the burst sizes observed in four realizations of each
condition, and black crosses indicate mean ± standard deviation. Significance analyzed by a multiple comparison test in ANOVA. *** P < 0.001.
communicate within the group more strongly than with the connectivity. The eight identified neuronal communities
rest of the network. The central panel shows the networks are not spatially separated, but all extend over the full
as a map with colored dots indicating neurons integrated observation area (2 × 1.5 mm²) and overlap each other. This
in the respective network. A larger dot size indicates higher finding indicates the existence of neuronal connections at
Volume 9 Issue 2 (2023) 360 https://doi.org/10.18063/ijb.v9i2.672