
Page 366 - IJB-9-2
P. 366
International Journal of Bioprinting Laser bioprinting of hiPSC-derived neural stem cells and neurons
The development of the network after printing under
neuronal differentiation conditions is shown in Figure 8A
and 8B. Panels depict the raster plots of activity for 1,000
individual neurons on top, and the averaged activity (termed
“global network activity”) at the bottom. Figure 8A shows
the development of printed neurons 27 (left), 39 (middle)
and 67 (right) days in differentiation medium after printing.
For comparison, Figure 8B shows the development for cells
that were neuronally pre-differentiated for 5 days, printed,
and then cultured in differentiation medium for additional
22 (left), 44 (middle), and 67 (right) days after printing.
We note that, for printed NSCs, no collective activity could
be observed at 27 days in the example shown. However,
the time of the first appearance of bursting events varied
among experimental realizations, and thus in other
experiments with NSCs of different passages we already
observed bursting events before day 20. Overall, the panels
reveal a gradual increase of activity, with clear bursts at
day 39 that become stronger at day 67 and later. Thus,
there is a clear evolution of burst over time. In the case of
pre-differentiated neurons, these collective activity events
could already be observed after 22 days (or 27 days of total
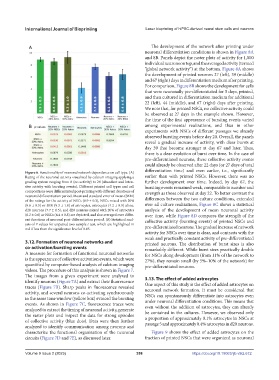
Figure 6. Functionality of neuronal network dependence on cell type. (A) differentiation time) and even earlier, i.e., significantly
Rating of the neuronal activity visualized by calcium imaging applying a earlier than with printed NSCs. However, there was no
grading system ranging from 0 (no activity) to 24 (abundant and inten- further development over time. Indeed, by day 67, the
sive activity with bursting events). Different printed cell types and cell bursting events remained weak, comparable in number and
compositions were differentiated post-printing with different durations of strength as those observed at day 22. To better contrast the
neuronal differentiation period. Mean and standard error of mean (SEM)
of the ratings for the activity of NSCs (8.9 ± 0.3), NSCs mixed with 20% differences between the two culture conditions, extended
(8.6 ± 0.5) or 50% (9.3 ± 1.0) of astrocytes, astrocytes (4.2 ± 0.9) alone, over all culture realizations, Figure 8C shows a statistical
d20 neurons (7.7 ± 0.5), and d20 neurons mixed with 20% of astrocytes analysis of the development of mean neuronal activity
(6.2 ± 0.6) or NSCs (6.4 ± 0.8) are depicted, and also averaged over differ- over time, while Figure 8D compares the strength of the
ent durations of neuronal post-differentiation period. (B) Statistical anal- collective activity (bursting events) of printed NSCs and
ysis of P values for unpaired two-sample t-test, which are highlighted in
red if less than the significance level of 0.05. pre-differentiated neurons. The gradual increase of network
activity for NSCs over time is clear, and contrasts with the
weak and practically constant activity of pre-differentiated
3.12. Formation of neuronal networks and printed neurons. The distribution of burst sizes is also
co-activation/bursting events remarkably different. While burst sizes practically double
A measure for formation of functional neuronal networks for NSCs along development (from 11% of the network to
is the appearance of collective activation events, which were 27%), they remain small (by 5%–10% of the network) for
quantified by computer-based analysis of calcium imaging pre-differentiated neurons.
videos. The procedure of this analysis is shown in Figure 7.
The images from a given experiment were analyzed to
identify neurons (Figure 7A) and extract their fluorescence 3.13. The effect of added astrocytes
traces (Figure 7B). Sharp peaks in fluorescence revealed One aspect of this study is the effect of added astrocytes on
activity, and several neurons co-activating synchronously neuronal network formation. It must be considered that
in the same time window (yellow box) evinced the bursting NSCs can spontaneously differentiate into astrocytes even
events. As shown in Figure 7C, fluorescence traces were under neuronal differentiation conditions. This means that
analyzed to extract the timing of neuronal activity, generate even without the addition of astrocytes, they can already
the raster plots and inspect the data for strong episodes be contained in the cultures. However, we observed only
of collective activity (blue dots). Data were then further a proportion of approximately 0.1% astrocytes in NSCs at
analyzed to identify communication among neurons and passage 5 and approximately 0.4% astrocytes in d20 neurons.
characterize the functional organization of the neuronal Figure 9 shows the effect of added astrocytes on the
circuits (Figure 7D and 7E), as discussed later. fraction of printed NSCs that were organized as neuronal
Volume 9 Issue 2 (2023) 358 https://doi.org/10.18063/ijb.v9i2.672