
Page 13 - IJB-9-3
P. 13
International Journal of Bioprinting Bioprinting of PDAC microtissues for drug screening
A B C
D E
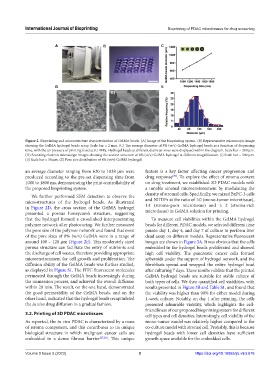
Figure 2. Bioprinting and microstructure characterization of GelMA beads. (A) Image of the bioprinting system. (B) Representative microscopic image
showing the GelMA hydrogel beads array. Scale bar = 2 mm. (C) The average diameter of 8% (w/v) GelMA hydrogel beads as a function of dispensing
time, with the air pressure of printing fixed at 0.1 MPa. Hydrogel beads at different diameter sizes were displayed within the diagram. Scale bar = 200 μm.
(D) Scanning electron microscope images showing the section structure of 8% (w/v) GelMA hydrogel at different magnification. (i) Scale bar = 500 μm.
(ii) Scale bar = 50 μm. (E) Pore size distribution of 8% (w/v) GelMA hydrogel.
an average diameter ranging from 620 to 1038 μm were feature is a key factor affecting cancer progression and
produced according to the pre-set dispensing time from drug response . To explore the effect of stroma content
[29]
1000 to 1800 ms, demonstrating the print controllability of on drug treatment, we established 3D PDAC models with
the proposed bioprinting system. a tunable stromal microenvironment by modulating the
density of stromal cells. Specifically, we mixed BxPC-3 cells
We further performed SEM detection to observe the
microstructures of the hydrogel beads. As illustrated and NHDFs at the ratio of 1:0 (mono-tumor microtissue),
in Figure 2D, the cross section of the GelMA hydrogel 1:1 (stroma-poor microtissue) and 1: 2 (stroma-rich
presented a porous honeycomb structure, suggesting microtissue) in GelMA solution for printing.
that the hydrogel formed a crosslinked interpenetrating To measure cell viabilities within the GelMA hydrogel
polymer network after photocuring. We further measured beads for different PDAC models, we selected different time
the pore size of the polymer network and found that most points: day 1, day 4, and day 7 of culture to perform live/
of the pore sizes of 8% (w/v) GelMA were in a range of dead assay on different models. Representative fluorescent
around 100 – 120 μm (Figure 2E). This moderately sized images are shown in Figure 3A. It was obvious that the cells
porous structure can facilitate the entry of nutrients and embedded in the hydrogel beads proliferated and showed
the discharge of cell wastes, therefore providing appropriate high cell viability. The pancreatic cancer cells formed
microenvironment for cell growth and proliferation. The spheroids under the support of hydrogel network, and the
diffusion ability of the GelMA beads was further studied, fibroblasts spread and wrapped the entire hydrogel bead
as displayed in Figure S1. The FITC fluorescent molecules after culturing 7 days. These results validate that the printed
permeated through the GelMA beads increasingly during GelMA hydrogel beads are suitable for stable culture of
the immersion process, and achieved the overall diffusion both types of cells. We then quantified cell viabilities, with
within 20 min. The result, on the one hand, demonstrated results presented in Figure 3B and Table S1, and found that
the good permeability of the GelMA beads, and on the the viability was higher than 90% for either model during
other hand, indicated that the hydrogel beads recapitulated 1-week culture. Notably, on day 1 after printing, the cells
the in vivo drug diffusion in a gradual fashion. presented admirable viability, which highlights the cell-
friendliness of our proposed bioprinting system for different
3.2. Printing of 3D PDAC microtissues cell types and cell densities. Interestingly, cell viability of the
As reported, the in vivo PDAC is characterized by a mass mono-tumor model was relatively higher compared to the
of stroma component, and this contributes to its unique co-culture model with stromal cell. Probably, this is because
biological structure in which malignant cancer cells are hydrogel beads with lower cell densities have sufficient
embedded in a dense fibrous barrier [27,28] . This unique growth space available for the embedded cells.
Volume 9 Issue 3 (2023) 5 https://doi.org/10.18063/ijb.v9i3.676