
Page 14 - IJB-9-3
P. 14
International Journal of Bioprinting Bioprinting of PDAC microtissues for drug screening
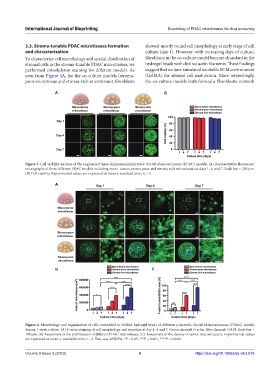
3.3. Stroma-tunable PDAC microtissues formation showed mostly round cell morphology at early stage of cell
and characterization culture (day 1). However, with increasing days of culture,
To characterize cell morphology and spatial distribution of fibroblasts in the co-culture model became abundant in the
stromal cells in the stroma-tunable PDAC microtissues, we hydrogel beads with distinct actin filaments. These findings
performed cytoskeleton staining for different models. As suggest that we have simulated a suitable ECM environment
seen from Figure 4A, for the co-culture models (stroma- (GelMA) for stromal cell maturation. More interestingly,
poor microtissue and stroma-rich microtissue), fibroblasts the co-culture models both formed a fibroblastic network
A B
Figure 3. Cell viability analysis of the engineered three-dimensional pancreatic ductal adenocarcinoma (PDAC) models. (A) Representative fluorescent
micrographs of three different PDAC models including mono-tumor, stroma-poor and stroma-rich microtissues at days 1, 4, and 7. Scale bar = 200 μm.
(B) Cell viability. Experimental values are expressed in mean ± standard error, n = 3.
A
B C
Figure 4. Morphology and organization of cells embedded in GelMA hydrogel beads of different pancreatic ductal adenocarcinoma (PDAC) models
during 1-week culture. (A) F-actin staining of cell morphology and structure at day 1, 4 and 7. Green channel: F-actin. Blue channel: DAPI. Scale bar =
100 μm. (B) Assessment of the proliferation of different PDAC microtissues. (C) Assessment of the density of tumor microstructure. Experimental values
are expressed in mean ± standard error, n = 3. Two-way ANOVA, *P < 0.05, ***P < 0.001, ****P < 0.0001.
Volume 9 Issue 3 (2023) 6 https://doi.org/10.18063/ijb.v9i3.676