
Page 16 - IJB-9-3
P. 16
International Journal of Bioprinting Bioprinting of PDAC microtissues for drug screening
A
B C
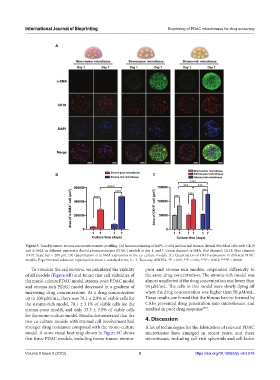
Figure 5. Tunable tumor-stroma microenvironment profiling. (A) Immunostaining of BxPC-3 cells and normal human dermal fibroblast cells with CK19
and α-SMA in different pancreatic ductal adenocarcinoma (PDAC) models at day 1, and 7. Green channel: α-SMA. Red channel: CK19. Blue channel:
DAPI. Scale bar = 200 μm. (B) Quantitation of α-SMA expression in the co-culture models. (C) Quantitation of CK19 expression in different PDAC
models. Experimental values are expressed in mean ± standard error, n = 3. Two-way ANOVA, *P < 0.05, **P < 0.01, ***P < 0.001, ****P < 0.0001.
To visualize the cell survival, we calculated the viability poor and stroma-rich models, responded differently to
of all models (Figure 6B) and found that cell viabilities of the same drug concentration. The stroma-rich model was
the mono-culture PDAC model, stroma-poor PDAC model almost unaffected if the drug concentration was lower than
and stroma-rich PDAC model decreased in a gradient of 50 μM/mL. The cells in this model were slowly dying off
increasing drug concentrations. At a drug concentration when the drug concentration was higher than 50 μM/mL.
up to 100 μM/mL, there was 78.1 ± 2.9% of viable cells for These results confirmed that the fibrous barrier formed by
the stroma-rich model, 70.1 ± 3.1% of viable cells for the CAFs prevented drug penetration into microtissues, and
[38]
stroma-poor model, and only 33.3 ± 3.5% of viable cells resulted in poor drug response .
for the mono-culture model. Results demonstrated that the
two co-culture models with stromal cell involvement had 4. Discussion
stronger drug resistance compared with the mono-culture A lot of technologies for the fabrication of relevant PDAC
model. A more visual heat map shown in Figure 6C shows microtissues have emerged in recent years, and these
that three PDAC models, including mono-tumor, stroma- microtissues, including cell-rich spheroids and cell-laden
Volume 9 Issue 3 (2023) 8 https://doi.org/10.18063/ijb.v9i3.676