
Page 146 - IJB-9-3
P. 146
International Journal of Bioprinting Bioprinting tissue-engineered bone-periosteum biphasic complex.
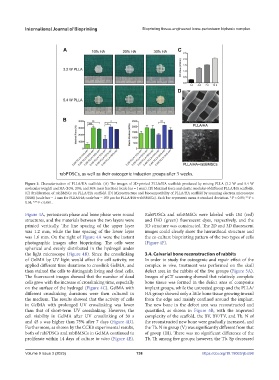
Figure 3. Characterization of PLLA/HA scaffolds. (A) The images of 3D-printed PLLA/HA scaffolds produced by mixing PLLA (3.2 W and 5.4 W
molecular weight) and HA (10%, 20%, and 30% mass fraction) (scale bar = 1 mm). (B) Maximal force and elastic modulus of different PLLA/HA scaffolds.
(C) Proliferation of rabBMSCs on PLLA/HA scaffold. (D) Microstructure and biocompatibility of PLLA/HA scaffold by scanning electron microscope
(SEM) (scale bar = 1 mm for PLLA/HA; scale bar = 100 μm for PLLA/HA+rabBMSCs). Each bar represents mean ± standard deviation. *P < 0.05; **P <
0.01; ***P < 0.001.
Figure 4A, periosteum phase and bone phase were round RabPDSCs and rabBMSCs were labeled with DiI (red)
structures, and the materials between the two layers were and DiO (green) fluorescent dyes, respectively, and the
printed vertically. The line spacing of the upper layer 3D structure was constructed. The 2D and 3D fluorescent
was 1.2 mm, while the line spacing of the lower layer images could clearly show the hierarchical structure and
was 1.6 mm. On the right of Figure 4A were the instant the co-culture bioprinting pattern of the two types of cells
photographic images after bioprinting. The cells were (Figure 4F).
spherical and evenly distributed in the hydrogel under
the light microscope (Figure 4B). Since the crosslinking 3.4. Calvarial bone reconstruction of rabbits
of GelMA by UV light would affect the cell activity, we In order to study the osteogenic and repair effect of the
applied different time durations to crosslink GelMA, and complex in vivo, treatment was performed on the skull
then stained the cells to distinguish living and dead cells. defect area in the rabbits of the five groups (Figure 5A).
The fluorescent images showed that the number of dead Images of µCT scanning showed that relatively complete
cells grew with the increase of crosslinking time, especially bone tissue was formed in the defect area of composite
on the surface of the hydrogel (Figure 4C). GelMA with implant groups, while the untreated group and the PLLA/
different crosslinking durations were then cultured in HA group showed only a little bone tissue growing inward
the medium. The results showed that the activity of cells from the edge and mainly confined around the implant.
in GelMA with prolonged UV crosslinking was lower The new bone in the defect area was reconstructed and
than that of short-term UV crosslinking. However, the quantified, as shown in Figure 5B, with the improved
cell viability in GelMA after UV crosslinking of 30 s complexity of the scaffold, the BV, BV/TV, and Tb. N of
and 45 s was higher than 75% after 7 days (Figure 4D). the reconstructed new bone were gradually increased, and
Furthermore, as shown by the CCK8 experimental results, the Tb. N in group (V) was significantly different from that
both of rabPDSCs and rabBMSCs in GelMA continued to of group (III). There was no significant difference of the
proliferate within 14 days of culture in vitro (Figure 4E). Tb. Th among five groups; however, the Tb. Sp decreased
Volume 9 Issue 3 (2023) 138 https://doi.org/10.18063/ijb.698