
Page 147 - IJB-9-3
P. 147
International Journal of Bioprinting Bioprinting tissue-engineered bone-periosteum biphasic complex.
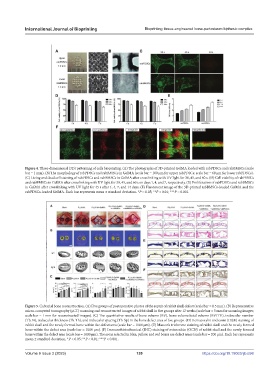
Figure 4. Three-dimensional (3D) patterning of cells bioprinting. (A) The photographs of 3D-printed GelMA loaded with rabPDSCs and rabBMSCs (scale
bar = 1 mm). (B) The morphology of rabPDSCs and rabBMSCs in GelMA (scale bar = 100 μm for upper rabPDSCs; scale bar = 60 μm for lower rabPDSCs).
(C) Living and dead cell staining of rabPDSCs and rabBMSCs in GelMA after crosslinking with UV light for 30, 45, and 60 s. (D) Cell viability of rabPDSCs
and rabBMSCs in GelMA after crosslinking with UV light for 30, 45, and 60 s on days 1, 4, and 7, respectively. (E) Proliferation of rabPDSCs and rabBMSCs
in GelMA after crosslinking with UV light for 45 s after 1, 4, 7, and 14 days. (F) Fluorescent image of the 3D-printed rabBMSCs-loaded GelMA and the
rabPDSCs-loaded GelMA. Each bar represents mean ± standard deviation. *P < 0.05; **P < 0.01; ***P < 0.001.
Figure 5. Calvarial bone reconstruction. (A) Five groups of postoperative photos of the repair of rabbit skull defect (scale bar = 0.5 mm). (B) Representative
micro-computed tomography (µCT) scanning and reconstructed images of rabbit skull in five groups after 12 weeks (scale bar = 5 mm for scanning images;
scale bar = 1 mm for reconstructed images). (C) The quantitative results of bone volume (BV), bone volume/total volume (BV/TV), trabecular number
(Tb. N), trabecular thickness (Tb. Th), and trabecular spacing (Tb. Sp) in the bone defect area of five groups. (D) Hematoxylin and eosin (H&E) staining of
rabbit skull and the newly formed bone within the defect area (scale bar = 1000 μm). (E) Masson’s trichrome staining of rabbit skull and the newly formed
bone within the defect area (scale bar = 1000 μm). (F) Immunohistochemical (IHC) staining of osteocalcin (OCN) of rabbit skull and the newly formed
bone within the defect area (scale bar = 1000 μm). The areas selected in blue, yellow, and red boxes are defect areas (scale bar = 200 μm). Each bar represents
mean ± standard deviation. *P < 0.05; **P < 0.01; ***P < 0.001.
Volume 9 Issue 3 (2023) 139 https://doi.org/10.18063/ijb.698