
Page 78 - IJB-9-3
P. 78
International Journal of Bioprinting 3DP hydrogels to combat antibiotic-resistant bacteria
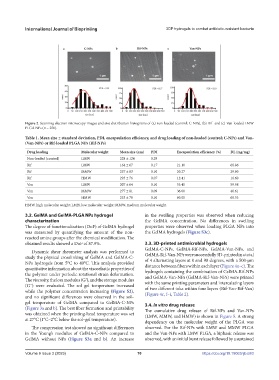
Figure 2. Scanning electron microscopy images and size distribution histograms of (a) non-loaded (control; C-NPs), (b) Rif- and (c) Van-loaded LMW
PLGA NPs (n = 250).
Table 1. Mean size ± standard deviation, PDI, encapsulation efficiency, and drug loading of non-loaded (control; C-NPs) and Van-
(Van-NPs) or Rif-loaded PLGA NPs (Rif-NPs)
Drug loading Molecular weight Mean size (nm) PDI Encapsulation efficiency (%) DL (mg/mg)
Non-loaded (control) LMW 228 ± 124 0.29
Rif LMW 164 ± 67 0.17 21.10 68.86
Rif MMW 257 ± 83 0.10 20.27 29.80
Rif HMW 293 ± 76 0.07 12.41 16.60
Van LMW 207 ± 64 0.10 53.40 59.98
Van MMW 277 ± 81 0.09 36.60 40.61
Van HMW 253 ± 78 0.10 60.00 68.53
HMW, high molecular weight; LMH, low molecular weight; MMW, medium molecular weight.
3.2. GelMA and GelMA-PLGA NPs hydrogel in the swelling properties was observed when reducing
characterization the GelMA concentration. No differences in swelling
The degree of functionalization (DoF) of GelMA hydrogel properties were observed when loading PLGA NPs into
was measured by quantifying the amount of the non- the GelMA hydrogels (Figure S3c).
reacted amine groups after the chemical modification. The
obtained results showed a DoF of 87.9%. 3.3. 3D-printed antimicrobial hydrogels
GelMA-C-NPs, GelMA-Rif-NPs, GelMA-Van-NPs, and
Dynamic shear rheometer analysis was performed to
study the physical crosslinking of GelMA and GelMA-C- GelMA-Rif-Van-NPs were successfully 3D-printed in a total
of 4 alternating layers at 0 and 90 degrees, with a 500-µm
NPs hydrogels from 5°C to 40°C. This analysis provided distance between fibers within each layer (Figure 4a–c). The
quantitative information about the viscoelastic properties of hydrogels containing the combination of GelMA-Rif-NPs
the polymer under periodic rotational strain deformation. and GelMA-Van-NPs (GelMA-Rif-Van-NPs) were printed
The viscosity, the loss modulus (Gʹ), and the storage modulus with the same printing parameters and intercalating layers
(G˝) were evaluated. The sol–gel temperature increased of two different inks within four layers (Rif-Van-Rif-Van)
while the polymer concentration increasing (Figure S2), (Figure 4c, f–i, Table 2).
and no significant differences were observed in the sol–
gel temperature of GelMA compared to GelMA-C-NPs 3.4. In vitro drug release
(Figure 3a and b). The best fiber formation and printability The cumulative drug release of Rif-NPs and Van-NPs
was obtained when the printing-head temperature was set (LMW, MMW, and HMW) is shown in Figure 5. A strong
at 27°C (1°C–2°C below the sol–gel temperature).
dependency on the molecular weight of the PLGA was
The compression test showed no significant differences observed. For the Rif-NPs with LMW and MMW PLGA
in the Young’s modulus of GelMA-C-NPs compared to and the Van-NPs with LMW PLGA, a biphasic release was
GelMA without NPs (Figure S3a and b). An increase observed, with an initial burst release followed by a sustained
Volume 9 Issue 3 (2023) 70 https://doi.org/10.18063/ijb.683