
Page 102 - IJB-9-4
P. 102
International Journal of Bioprinting 3D-Printed liver model
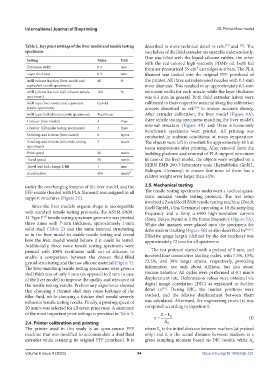
Table 2. Key print settings of the liver model and tensile testing described in more technical detail in refs. and [38] . The
[37]
specimens two halves of the fluid extruder are operable independently.
One was filled with the liquid silicone rubber, the other
Setting Value Unit with the red-colored high-viscosity PDMS oil, both fed
Extrusion width 0.5 mm from air-pressurized 55-cm³ cartridges at 6 bars. The PLA
Layer thickness 0.3 mm filament was loaded into the original FFF printhead of
Infill volume fraction (liver model and 40 % the printer. All three extruders used nozzles with 0.4-mm
equivalent tensile specimens) inner diameter. This resulted in an approximately 0.5-mm
Infill volume fraction (full-silicone tensile 100 % extrusion width for each nozzle, while the layer thickness
specimens) was 0.3 mm in general. Both fluid extruder halves were
Infill type (liver model and equivalent Gyroid calibrated to their respective material along the calibration
tensile specimens) process described in ref. to ensure accurate dosing.
[38]
Infill type (full-silicone tensile specimens) Rectilinear After extruder calibration, the liver model (Figure 4A),
Contour (liver model) 4 lines three tensile testing specimens matching the liver model’s
internal structure (Figure 4B) and three silicone-only
Contour (all tensile testing specimens) 2 lines benchmark specimens were printed. All printing was
Solid top and bottom (liver model) 6 layers conducted in ambient conditions, at room temperature.
Solid top and bottom (all tensile testing 3 layers The objects were left to crosslink for approximately 48 h at
specimens) room temperature after printing. After removal from the
Print speed 20 mm/s building platform and removal of PLA support structures
Travel speed 50 mm/s in case of the liver model, the objects were weighed on a
Travel and tool change Z-lift 1 mm KERN EMB 200-3 laboratory scale (Kern&Sohn GmbH,
Balingen, Germany) to ensure that none of them has a
Acceleration 500 mm/s²
relative weight error larger than ±5%.
under the overhanging features of the liver model, and the 2.5. Mechanical testing
FFF-nozzle (loaded with PLA filament) was assigned to all The tensile testing specimens underwent a cyclical quasi-
support structures (Figure 2E). static uniaxial tensile testing protocol. The test setup
involved a ZwickRoell Z030 tensile testing machine (Zwick
Since the liver model’s organic shape is incompatible Roell GmbH, Ulm, Germany) operating at 10 Hz sampling
with standard tensile testing protocols, the ASTM D638- frequency and a Sony α-6400 high-resolution camera
14 Type I tensile testing specimen geometry was printed (Sony, Tokyo, Japan) at 1 Hz frame frequency (Figure 5A).
[45]
three times with 7-mm thickness, approximately 1-mm White dot markers were placed onto the specimens for
solid shell (Table 2) and the same internal structuring deformation tracking (Figure 5B) as also described in [46,47] .
as in the liver model to enable tensile testing and reveal Effective gauge length (defined by the dot markers) was
how the liver model would behave if it could be tested. approximately 72 mm for all specimens.
Additionally, three more tensile testing specimens were
printed with 100% rectilinear infill out of silicone, to The test protocol started with a preload of 5 mm, and
enable a comparison between the chosen fluid-filled involved four consecutive loading cycles, with 7.5%, 15%,
gyroid structuring and the raw silicone material (Figure 3). 22.5%, and 30% target strains, respectively, providing
The liver-matching tensile testing specimens were given a information not only about stiffness, but also about
shell thickness of only 1 mm (as opposed to 2 mm in case viscous behavior. All cycles were performed at 0.1 mm/s
of the liver model) to improve the quality and relevance of displacement rate. Deformation values were obtained via
the tensile testing results. Preliminary experience showed digital image correlation (DIC) as explained in further
[46]
that choosing a thinner shell may cause leakages of the detail in . During DIC, the marker positions were
filler fluid, while choosing a thicker shell would severely tracked, and the relative displacement between them
influence tensile testing results. Finally, a printing speed of was calculated. Afterward, the engineering strain (ε) was
20 mm/s was selected for all seven print runs. A summary computed according to Equation I:
of the most important print settings is provided in Table 2. LL
0 (I)
2.4. Printer calibration and printing A 0
The printer used in this study is an open-source FFF where L is the initial distance between markers (at preload
0
machine that was modified to accommodate a dual fluid only) and L is the actual distance between markers at a
extruder while retaining its original FFF printhead. It is given sampling moment based on DIC results, while A
0
Volume 9 Issue 4 (2023) 94 https://doi.org/10.18063/ijb.721