
Page 103 - IJB-9-4
P. 103
International Journal of Bioprinting 3D-Printed liver model
Figure 3. Tensile testing specimens after slicing in Prusa Slicer, with a liver-matching specimen (bottom) and a full-silicone benchmark specimen (top)
displayed with the top layers hidden, to compare the inside of the specimens.
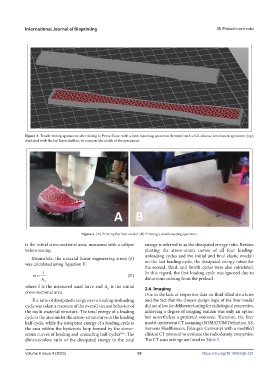
Figure 4. (A) Printing the liver model. (B) Printing a tensile testing specimen.
is the initial cross-sectional area, measured with a caliper energy is referred to as the dissipated energy ratio. Besides
before testing. plotting the stress–strain curves of all four loading-
unloading cycles and the initial and final elastic moduli
Meanwhile, the uniaxial linear engineering stress (σ)
was calculated using Equation II: on the last loading cycle, the dissipated energy ratios for
the second, third, and fourth cycles were also calculated.
f In this regard, the first loading cycle was ignored due to
(II)
A 0 distortions coming from the preload.
where f is the measured axial force and A is the initial 2.6. Imaging
0
cross-sectional area. Due to the lack of respective data on fluid-filled structures
The ratio of dissipated energy over a loading-unloading and the fact that the chosen design logic of the liver model
cycle was taken a measure of the overall viscous behavior of did not allow for deliberate tuning for radiological properties,
the multi-material structure. The total energy of a loading achieving a degree of imaging realism was only an option
cycle is the area under the stress–strain curve of the loading but nevertheless a preferred outcome. Therefore, the liver
half-cycle, while the dissipated energy of a loading cycle is model underwent CT scanning (SOMATOM Definition AS,
the area within the hysteresis loop formed by the stress– Siemens Healthineers, Erlangen Germany) with a modified
strain curves of loading and unloading half-cycles . The clinical CT protocol to evaluate the radiodensity properties.
[48]
dimensionless ratio of the dissipated energy to the total The CT scan settings are listed in Table 3.
Volume 9 Issue 4 (2023) 95 https://doi.org/10.18063/ijb.721