
Page 104 - IJB-9-4
P. 104
International Journal of Bioprinting 3D-Printed liver model
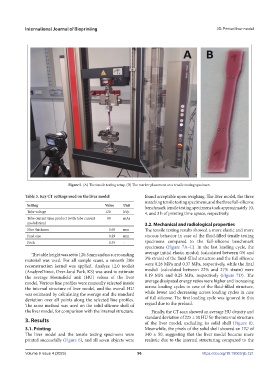
Figure 5. (A) The tensile testing setup. (B) The marker placement on a tensile testing specimen.
Table 3. Key CT settings used on the liver model found acceptable upon weighing. The liver model, the three
matching tensile testing specimens, and the three full-silicone
Setting Value Unit benchmark tensile testing specimens took approximately 10,
Tube voltage 120 kVp 4, and 3 h of printing time apiece, respectively.
Tube current time product (with tube current 80 mAs
modulation) 3.2. Mechanical and radiological properties
Slice thickness 0.60 mm The tensile testing results showed a more elastic and more
Pixel size 0.29 mm viscous behavior in case of the fluid-filled tensile testing
Pitch 0.55 - specimens compared to the full-silicone benchmark
specimens (Figure 7A–C). In the last loading cycle, the
The table height was set to 120.5 mm and no surrounding average initial elastic moduli (calculated between 0% and
material was used. For all sample scans, a smooth J30s 3% strain) of the fluid-filled structure and the full silicone
reconstruction kernel was applied. Analyze 12.0 toolkit were 0.26 MPa and 0.37 MPa, respectively, while the final
(AnalyzeDirect, Over-land Park, KS) was used to estimate moduli (calculated between 22% and 27% strain) were
the average Hounsfield unit (HU) values of the liver 0.19 MPa and 0.25 MPa, respectively (Figure 7D). The
model. Various line profiles were manually selected inside average dissipated energy ratios were higher and increasing
the internal structure of liver model, and the overall HU across loading cycles in case of the fluid-filled structure,
was estimated by calculating the average and the standard while lower and decreasing across loading cycles in case
deviation over all points along the selected line profiles. of full silicone. The first loading cycle was ignored in this
The same method was used on the solid silicone shell of regard due to the preload.
the liver model, for comparison with the internal structure. Finally, the CT scan showed an average HU density and
3. Results standard deviation of 225 ± 30 HU for the internal structure
of the liver model, excluding its solid shell (Figure 8).
3.1. Printing Meanwhile, the pixels of the solid shell showed an HU of
The liver model and the tensile testing specimens were 340 ± 50, suggesting that the liver model became more
printed successfully (Figure 6), and all seven objects were realistic due to the internal structuring compared to the
Volume 9 Issue 4 (2023) 96 https://doi.org/10.18063/ijb.721