
Page 106 - IJB-9-4
P. 106
International Journal of Bioprinting 3D-Printed liver model
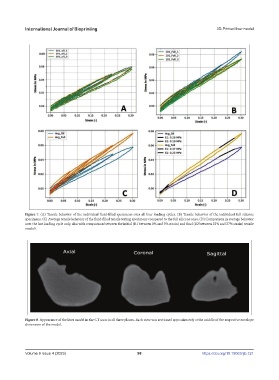
Figure 7. (A) Tensile behavior of the individual fluid-filled specimens over all four loading cycles. (B) Tensile behavior of the individual full silicone
specimens. (C) Average tensile behavior of the fluid-filled tensile testing specimens compared to the full silicone ones. (D) Comparison in average behavior
over the last loading cycle only, also with comparison between the initial (E1 between 0% and 3% strain) and final (E2 between 22% and 27% strain) tensile
moduli.
Figure 8. Appearance of the liver model in the CT scan in all three planes. Each view was sectioned approximately at the middle of the respective envelope
dimension of the model.
Volume 9 Issue 4 (2023) 98 https://doi.org/10.18063/ijb.721