
Page 127 - IJB-9-4
P. 127
International Journal of Bioprinting 3D bioprinted models in pediatric tumors
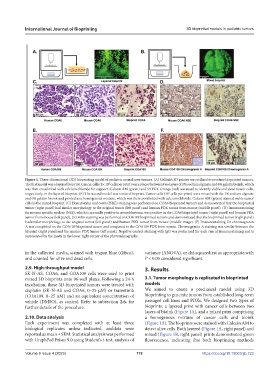
Figure 1. Three-dimensional (3D) bioprinting model of pediatric neural crest tumors. (A) Cellink’s 3D printer was utilized to produce bioprinted tumors.
The first model was a layered bioprint. Cancer cells (5× 10 cells per print) were placed between two layers of 1% sodium alginate and 6% gelatin bioink, which
5
was then crosslinked with calcium chloride for support. Calcein AM (green) and SYTOX Orange (red) wereused to identify viable and dead tumor cells,
respectively, in the layered bioprint. (B) The second model was a mixed bioprint. Tumor cells (10 cells per print) were mixed with the 1% sodium alginate
7
and 6% gelatin bioink and printed as a homogenous mixture, which was then crosslinked with calcium chloride. Calcein AM (green) stained viable tumor
cells in the mixed bioprint. (C) Hematoxylin and eosin (H&E) staining was performed on COA6 bioprinted tumors and demonstrated that the bioprinted
tumor (right panel) had similar morphology to the original tumor (left panel) and human PDX tumor from mouse (middle panel). (D) Immunostaining
for neuron specific enolase (NSE), which is normally positive in neuroblastoma, was positive in the COA6 bioprinted tumor (right panel) and human PDX
tumor from mouse (left panel). (E) H&E staining was performed on COA109 bioprinted tumors and demonstrated that the bioprinted tumor (right panel)
hadsimilar morphology to the original tumor (left panel) and human PDX tumor from mouse (middle image). (F) Immunostaining for chromogranin
A was completed on the COA109 bioprinted tumor and compared to the COA109 PDX from mouse. Chromogranin A staining was similar between the
bioprint (right panel)and the murine PDX tumor (left panel). Negative control staining with IgG was performed for each run of immunostaining and is
represented by the insets in the lower right corner of the photomicrographs.
in the collected media, stained with trypan blue (Gibco), variance (ANOVA), or chi-squaredtest as appropriate,with
and counted for alive and dead cells. P < 0.05 considered significant.
2.9. High-throughput model 3. Results
SK-N-AS, COA6, and COA109 cells were used to print
mixed 3D bioprints onto 96-well plates. Following a 24-h 3.1. Tumor morphology is replicated in bioprinted
incubation, these 3D-bioprinted tumors were treated with models
cisplatin (SK-N-AS and COA6, 0–25 µM) or trametinib We aimed to create a preclinical model using 3D
(COA109, 0–25 nM) and an equivalent concentration of bioprinting to generate tumors from established long-term
vehicle (DMSO), as control. Refer to subsection 2.6. for passaged cell lines and PDXs. We designed two types of
further details of the procedure. bioprints: a layered print with cancer cells between two
layers of bioink (Figure 1A), and a mixed print comprising
2.10. Data analysis a homogenous mixture of cancer cells and bioink
Each experiment was completed with at least three (Figure 1B). The bioprints were stained with Calcein AM to
biological replicates unless indicated, anddata were detect alive cells. Both layered (Figure 1A, right panel) and
reported as mean ± SEM. Statistical analysis was performed mixed (Figure 1B, right panel) prints demonstrated green
with GraphPad Prism 9.0 using Student’s t-test, analysis of fluorescence, indicating that both bioprinting methods
Volume 9 Issue 4 (2023) 119 https://doi.org/10.18063/ijb.723