
Page 131 - IJB-9-4
P. 131
International Journal of Bioprinting 3D bioprinted models in pediatric tumors
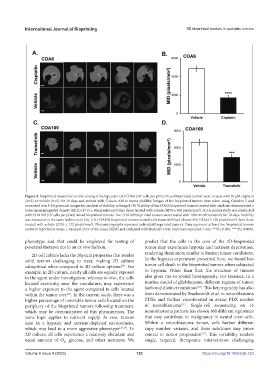
Figure 4. Bioprinted models for ex vivo testing of therapeutics. (A) COA6 (10 cells per print) mixed bioprinted tumors were treated with 10 μM cisplatin
7
(n=5) or vehicle (n=5) for 10 days and stained with Calcein AM to assess viability. Images of the bioprinted tumors were taken using Cytation 5 and
converted into 8-bit grayscale images for analysis of viability in ImageJ. (B) Viability of the COA6 bioprinted tumors treated with cisplatin demonstrated a
lower mean integrated density (MID) (1713 ± 306 pixels/mm ) than those treated with vehicle (4878 ± 268 pixels/mm ). (C) A similar study was conducted
2
2
with COA109 (10 cells per print) mixed bioprinted tumors. The COA109 bioprinted tumors were treated with 100 nM of trametinib for 10 days. Viability
7
was measured in the same fashion as in (A). (D) COA109 bioprinted tumors treated with trametinib had a lower MID (1442 ± 120 pixels/mm ) than those
2
treated with vehicle (2336 ± 172 pixels/mm ). Photomicrographs represent individual bioprinted tumors. Data represent at least five bioprinted tumors
2
andwere reported as mean ± standard error of the mean (SEM) and evaluated with Student’s t-test. Scale bars represent 1 mm. ***P≤ 0.001, ****P≤ 0.0001.
phenotype and that could be employed for testing of predict that the cells in the core of the 3D-bioprinted
potential therapeutics in an ex vivo fashion. tumor may experience hypoxia and nutrient deprivation,
2D cell culture lacks the physical properties that render rendering them more similar to human tumor conditions.
solid tumors challenging to treat, making 2D culture In the hypoxia experiment presented here, we found less
suboptimal when compared to 3D culture options . For tumor cell death in the bioprinted tumors when subjected
[26]
example, in 2D culture, nearly all cells are equally exposed to hypoxia. Other than that, the structure of tumors
to the agent under investigation, whereas in vivo, the cells also gives rise to spatial heterogeneity. For instance, in a
located exteriorly, near the vasculature, may experience murine model of glioblastoma, different regions of tumor
[30]
a higher exposure to the agent compared to cells located harbored distinct mutations . This heterogeneity has also
within the tumor core . In the current study, there was a been demonstrated by Braekeveldt et al. in neuroblastoma
[27]
higher percentage of nonviable tumor cells located on the PDXs and further corroborated in avatar PDX models
[31]
periphery of the bioprinted tumors following treatment, of neuroblastoma . Single-cell sequencing on 16
which may be demonstrative of this phenomenon. The neuroblastoma patients has shown 160 different signatures
same logic applies to nutrient supply. In vivo, tumors that may contribute to malignancy in neural crest cells.
exist in a hypoxic and nutrient-depleted environment, Within a neuroblastoma tumor, cells harbor different
which may lead to a more aggressive phenotype [28,29] . In copy number variants, and these subclones may prove
2D culture, all cells experience a relatively abundant and central to tumor progression . This variability renders
[32]
equal amount of O , glucose, and other nutrients. We single, targeted, therapeutic interventions challenging
2
Volume 9 Issue 4 (2023) 123 https://doi.org/10.18063/ijb.723