
Page 325 - IJB-9-4
P. 325
International Journal of Bioprinting 3D printing in bone regeneration and bone repair
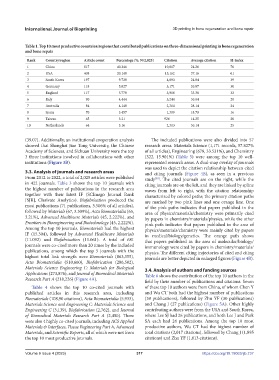
Table 1. Top 10 most productive countries/regions that contributed publications on three-dimensional printing in bone regeneration
and bone repair
Rank Country/region Article count Percentage (%, N/2,025) Citation Average citation H-index
1 China 817 40.346 19,817 24.26 70
2 USA 408 20.148 15,162 37.16 61
3 South Korea 197 9.728 4,893 24.84 39
4 Germany 118 5.827 3,171 26.87 30
5 England 117 5.778 3,906 33.38 32
6 Italy 90 4.444 3,244 36.04 28
7 Australia 84 4.148 2,364 28.14 24
8 Spain 70 3.457 1,309 18.70 16
9 Taiwan 65 3.21 926 14.25 20
10 Netherlands 64 3.16 2,313 36.14 25
(39.07). Additionally, an institutional cooperation analysis The included publications were also divided into 57
showed that Shanghai Jiao Tong University, the Chinese research areas. Materials Science (1,171 records, 57.827%
Academy of Sciences, and Sichuan University were the top of all articles), Engineering (679, 33.531%), and Chemistry
3 three institutions involved in collaborations with other (322, 15.901%) (Table 5) were among the top 10 well-
institutions (Figure 3B). represented research areas. A dual-map overlay of journals
was used to depict the citation relationship between cited
3.3. Analysis of journals and research areas and citing journals (Figure 4B), as seen in a previous
From 2012 to 2022, a total of 2,025 articles were published study . The cited journals are on the right, while the
[30]
in 422 journals. Table 3 shows the top 10 journals with citing journals are on the left, and they are linked by spline
the highest number of publications in the research area waves from left to right, with the citation relationship
together with their latest IF (SCImago Journal Rank characterized by colored paths; the primary citation paths
[SJR], Clarivate Analytics). Biofabrication produced the are marked by two pink lines and one orange line. One
most publications (71 publications, 3.506% of all articles), of the pink paths indicates that papers published in the
followed by Materials (67, 3.309%), Acta Biomaterialia (65, area of physics/materials/chemistry were primarily cited
3.21%), Advanced Healthcare Materials (45, 2.222%), and by papers in chemistry/materials/physics, while the other
Frontiers in Bioengineering and Biotechnology (45, 2.222%). pink path indicates that papers published in the area of
Among the top 10 journals, Biomaterials had the highest physics/materials/chemistry were mainly cited by papers
IF (15.304), followed by Advanced Healthcare Materials in medical/biology/genetics. The orange path shows
(11.092) and Biofabrication (11.061). A total of 681 that papers published in the area of molecular/biology/
journals were co-cited more than 20 times by the included immunology were cited by papers in chemistry/materials/
publications, among which the top 5 journals with the physics. The different citing trajectories of cited and citing
highest total link strength were Biomaterials (863,355), journals are better depicted in enlarged figures (Figure 4B).
Acta Biomaterialia (510,660), Biofabrication (286,502),
Materials Science Engineering C: Materials for Biological 3.4. Analysis of authors and funding sources
Applications (273,876), and Journal of Biomedical Materials Table 6 shows the contribution of the top 10 authors in the
Research Part A (218,226) (Figure 4A).
field by their number of publications and citations. Seven
Table 4 shows the top 10 co-cited journals with of these top 10 authors were from China, of whom Chen Y
published articles in this research area, including and Wu CT both had the highest number of publications
Biomaterials (108,90 citations), Acta Biomaterialia (5,933), (39 publications), followed by Zhu YF (30 publications)
Materials Science and Engineering C: Materials Science and and Chang J (27 publications) (Figure 5A). Other highly
Engineering C (3,139), Biofabrication (2,762), and Journal contributing authors were from the USA and South Korea,
of Biomedical Materials Research Part A (2,450). There where Lee SJ had 26 publications, and both Lee J and Park
were also 4 highly co-cited journals, including ACS Applied SA each had 24 publications. Among the top 10 most
Materials & Interfaces, Tissue Engineering Part A, Advanced productive authors, Wu CT had the highest number of
Materials, and Scientific Reports, all of which were not from total citations (2,017 citations), followed by Chang J (1,895
the top 10 most productive journals. citations) and Zhu YF (1,613 citations).
Volume 9 Issue 4 (2023) 317 https://doi.org/10.18063/ijb.737