
Page 364 - IJB-9-4
P. 364
k ()
International Journal of Bioprinting A computational model of cell viability and proliferation of 3D-bioprinted constructs
k ()
(
k+ ) 1
Ω
ρ
−
Ω
ρ
ρ
− ρ k () Ω 1 −
∆ t ρ max
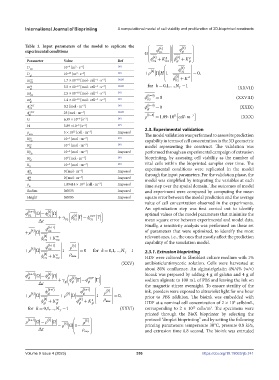
Table 1. Input parameters of the model to replicate the k ()
experimental conditions φ k () φ gl
G O2 g g
k k ()
φ
gl
Parameter Value Ref φ + K O gl k () + K
2
O2
-9
-1
2
D 10 [m ∙ s ] [10] () k
O2 φ
D 10 -10 [m ∙ s ] [10] +ρ () k Ω H 1 − O2 = 0,
2
-1
gl () k d
m m 1.7 × 10 -18 [mol ∙ cell ∙ s ] [10,24] φ O2 +K
-1
-1
O2
m m 3.5 × 10 -17 [mol ∙ cell ∙ s ] [10,24] for k = 01 ,,……,N T −1 (XXVII)
-1
-1
gl
-1
m g O2 2.5 × 10 -18 [mol ∙ cell ∙ s ] [24] ( k 0= )
-1
-1
m g gl 1.4 × 10 -16 [mol ∙ cell ∙ s ] [10] f O2 = 0 (XXVIII)
-1
ϕ OUT 0.2 [mol ∙ m ] [10] f ( k= ) 0 = 0 (XXIX)
-3
O2 gl
ϕ OUT 25 [mol ∙ m ] [10,25]
-3
gl r ( k= ) 0 =18910. ⋅ 11 cell m⋅ − (XXX)
3
G 6.39 × 10 [s ] [26]
-1
-6
-6
-1
H 3.89 ×10 [s ] [27]
2.3. Experimental validation
ρ max 5 × 10 [cell ∙ m ] Imposed The model validation was performed to assess its prediction
12
-3
K m 10 [mol ∙ m ] [24]
-3
-3
O2 capability in terms of cell concentration in the 3D geometric
K m 10 [mol ∙ m ] [28] model representing the construct. The validation was
-1
-3
gl
K g 10 [mol ∙ m ] Imposed performed through an experimental campaign of extrusion
-2
-3
O2
K g 10 [mol ∙ m ] [20] bioprinting, by assessing cell viability as the number of
0
-3
gl
-4
-3
K d 10 [mol ∙ m ] [29] vital cells within the bioprinted samples over time. The
-3
ϕ in 0 [mol ∙ m ] Imposed experimental conditions were replicated in the model
O2 through the input parameters. For the validation phase, the
ϕ in 0 [mol ∙ m ] Imposed
-3
gl model was simplified by integrating the variables at each
ρ 1.89414 × 10 [cell ∙ m ] Imposed
-3
11
in time step over the spatial domain. The outcomes of model
Radius 0.0035 Imposed and experiment were compared by computing the mean
Height 0.0005 Imposed square error between the model prediction and the average
value of cell concentration observed in the experiments.
An optimization step was first carried out to identify
k ()
φ ( O2 k 1+ ) Ω − φ O2 Ω + γ φ k () Γ − φ OUT Γ optimal values of the model parameters that minimize the
∆ t O2 O2 O2 mean square error between experimental and model data.
Finally, a sensitivity analysis was performed on these set
(
k++ ) 1
+ ρ k () Ω φ O2 of parameters that were optimized, to identify the most
φ () k 2 + K m 2 relevant ones, i.e., the ones that mostly affect the prediction
O
O
capability of the simulation model.
φ (k + ) 1 ρ () k
+ρ () k Ω O 2 1 − = 0 for k = 0 1,, … N, T −1 2.3.1. Extrusion bioprinting
φ () k + K g ρ max
O 2 O 2 HDF were cultured in fibroblast culture medium with 1%
(XXV) antibiotic/antimycotic solution. Cells were harvested at
about 80% confluence. An alginate/gelatin 4%/4% (w/v)
φ ( gl k+ ) 1 Ω − φ gl k () Ω + γ φ k () Γ − φ OUT Γ bioink was prepared by adding 4 g of gelatin and 4 g of
sodium alginate to 100 mL of PBS and leaving the ink on
∆ t gl gl gl the magnetic stirrer overnight. To ensure sterility of the
φ ( k++ ) 1 φ (k + ) 1 ρ () k ink, powders were exposed to ultraviolet light for one hour
+ ρ k () Ω gl +ρ () k Ω gl 1 − = 0, prior to PBS addition. The bioink was embedded with
φ () k + K m φ () k + K ρ max HDF at a nominal cell concentration of 2 × 10 cells/mL,
g
6
gl
gl
gl
gl
for k = 01 ,, …,N T −1 (XXVI) corresponding to 2 × 10 cells/m . The specimens were
3
12
printed through the BioX bioprinter by selecting the
ρ ( k+ ) 1 Ω − ρ k () Ω ρ k () protocol “droplet bioprinting” and by setting the following
− ρ k () Ω 1 − printing parameters: temperature 30°C, pressure 0.8 kPa,
∆ t ρ max and extrusion time 0.8 second. The bioink was extruded
φ k () φ k ()
G k k () O2 g k () gl g
φ +
+
φ
K
gl
O
2
gl
O2
Volume 9 Issue 4 (2023) K 356 https://doi.org/10.18063/ijb.741
φ () k
O2
+ρ () k Ω H 1 − φ () k +K d = 0,
O2
for k = 01 ,,……,N −1
T