Page 366 - IJB-9-4
P. 366

International Journal of Bioprinting   A computational model of cell viability and proliferation of 3D-bioprinted constructs


                                                               specific for fibroblasts. Oxygen concentration was taken
                                                               from McMurtrey . Glucose concentration was taken
                                                                             [10]
                                                               from the data sheet of DMEM, a basic culture medium
                                                               commonly used for several cell types, according to the
                                                               product catalog . The proliferation rate G was calculated
                                                                           [25]
                                                               based on the exponential cell growth phenomenon,
                                                               considering a duplication time of 24 h. A similar approach
                                                               was used by Higuera et al. . The death rate H was set in
                                                                                    [20]
                                                               order to observe a decrease in cell viability of 90% after
                                                               14 days in a hypoxic environment, as considered by Niu
                                                               et al. . The maximum cell concentration was imposed
                                                                   [27]
                                                               by considering that a  high percentage  of  the volume  of
                                                               the  bioprinted  construct  should  be  occupied  by  cells
                                                               after proliferation. The Michaelis–Menten and Monod
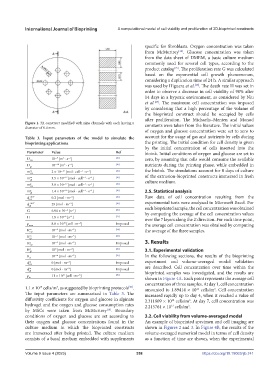
            Figure 1. 3X construct modified with nine channels with each having a   constants were taken from the literature. The initial values
            diameter of 0.4 mm.
                                                               of oxygen and glucose concentration were set to zero to
            Table  3.  Input  parameters  of  the  model  to  simulate  the   account for the usage of gas and nutrients by cells during
            bioprinting applicationa                           the printing. The initial condition for cell density is given
                                                               by the initial concentration of cells inserted into the
             Parameter  Value                     Ref          bioink. Initial conditions of oxygen and glucose are set to
                            2
                              -1
                         -9
             D O2      10  [m  ∙ s ]              [10]         zero, by assuming that cells would consume the available
                            2
             D gl      10 -10  [m  ∙ s ]          [10]         nutrients during the printing phase, while embedded in
                               -1
             m m       2 × 10 -17  [mol ∙ cell  ∙ s ]  [10]    the bioink. The simulations account for 8 days of culture
                                      -1
                                   -1
              O2
             m m       3.5 × 10 -17  [mol ∙ cell  ∙ s ]  [10]  of the extrusion-bioprinted constructs immersed in fresh
                                    -1
                                       -1
              gl                                               culture medium. 
             m g       3.8 × 10 -17  [mol ∙ cell  ∙ s ]  [10]
                                    -1
                                       -1
              O2
             m g gl    1.4 × 10 -16  [mol ∙ cell  ∙ s ]  [10]  2.5. Statistical analysis
                                       -1
                                    -1
                               -3
             ϕ O2 OUT  0.2 [mol ∙ m ]             [10]         Raw data of cell concentration resulting from the
             ϕ OUT     25 [mol ∙ m ]              [10]         experimental tests were analyzed in Microsoft Excel. For
                              -3
              gl                                               each bioprinted sample, the cell concentration was obtained
             G         6.94 × 10  [s ]            [20]         by computing the average of the cell concentration values
                             -6
                                -1
             H         1.9 × 10  [s ]             [27]         over the 7 layers along the Z direction. For each time point,
                               -1
                            -6
             ρ         8.8 × 10  [cell ∙ m ]      Imposed
                            13
                                   -3
             max                                               the average cell concentration was obtained by computing
                         -3
             K m O2    10  [mol ∙ m ]             [24]         the average of the three samples.
                                -3
             K m gl    10  [mol ∙ m ]             [28]
                                -3
                         -1
             K g       10  [mol ∙ m ]             Imposed      3. Results
                                -3
                         -2
              O2
             K g       10  [mol ∙ m ]             [20]         3.1. Experimental validation
                         0
                               -3
              gl
             K         10  [mol ∙ m ]             [29]         In the following sections, the results of the bioprinting
                         -4
                                -3
              d
             ϕ in O2   0 [mol ∙ m ]               Imposed      experiment and  volume-averaged  model  validation
                              -3
             ϕ in gl   0 [mol ∙ m ]               Imposed      are described. Cell concentration over time within the
                              -3
                                                               bioprinted  samples  was  investigated,  and  the  results  are
                            12
                                  -3
             ρ         11 × 10  [cell ∙ m ]       [30]
             in                                                shown in Figure 4A. Each point represents the average cell
                                                               concentration of three samples. At day 1, cell concentration
            1.1 × 10  cells/m , as suggested by bioprinting protocols .   amounted to 1.89414 × 10  cells/m . Cell concentration
                  13
                                                        [30]
                         3
                                                                                            3
                                                                                     11
            The input parameters are summarized in  Table 3. The   increased rapidly up to day 4, when it reached a value of
            diffusivity coefficients for oxygen and glucose in alginate   2.311809 × 10  cells/m . At day 7, cell concentration was
                                                                                  3
                                                                          12
            hydrogel and the oxygen and glucose consumption rates   2.215761 × 10  cells/m .
                                                                                 3
                                                                          12
            by MSCs were taken from McMurtrey . Boundary
                                               [10]
            conditions of oxygen and glucose are set according to   3.2. Cell viability from volume-averaged model
            their oxygen and glucose concentrations found in the   An example of bioprinted specimen and cell imaging are
            culture medium in which the bioprinted constructs   shown in Figures 2 and 3. In Figure 4B, the results of the
            are immersed after being printed. The culture medium   volume-averaged numerical model in terms of cell density
            consists of a basal medium embedded with supplements   as a function of time are shown, when the experimental
            Volume 9 Issue 4 (2023)                        358                         https://doi.org/10.18063/ijb.741
   361   362   363   364   365   366   367   368   369   370   371